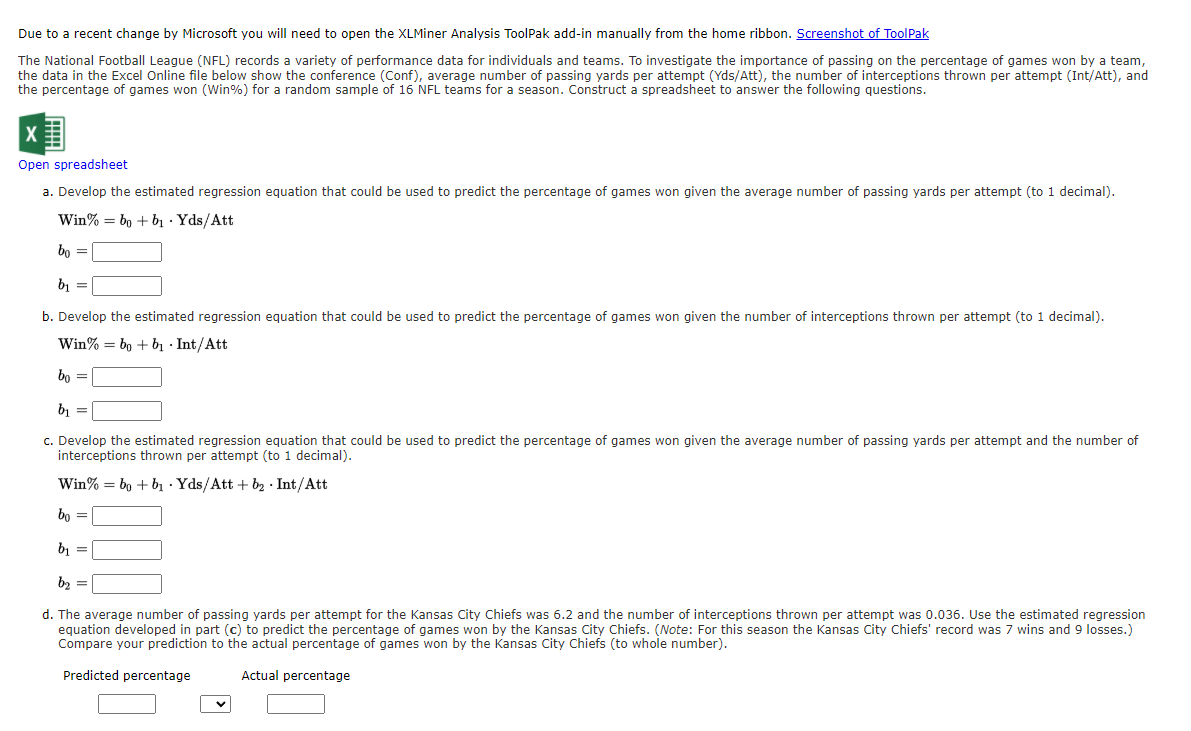
Question: Due to a recent change by Microsoft you will need to open the XLMiner Analysis ToolPak add-in manually from the home ribbon. Screenshot of ToolPak

Due to a recent change by Microsoft you will needDue to a recent change by Microsoft you will needDue to a recent change by Microsoft you will need

Due to a recent change by Microsoft you will need to open the XLMiner Analysis ToolPak add-in manually from the home ribbon. Screenshot of ToolPak The National Football League (NFL) records a variety of performance data for individuals and teams. To investigate the importance of passing on the percentage of games won by a team, the data in the Excel Online file below show the conference (Conf), average number of passing yards per attempt (Yds/Att), the number of interceptions thrown per attempt (Int/Att), and the percentage of games won (Win%) for a random sample of 16 NFL teams for a season. Construct a spreadsheet to answer the following questions. Open spreadsheet a. Develop the estimated regression equation that could be used to predict the percentage of games won given the average number of passing yards per attempt (to 1 decimal). Win% = b + b1 . Yds/Att bo = bi = b. Develop the estimated regression equation that could be used to predict the percentage of games won given the number of interceptions thrown per attempt (to 1 decimal). Win% = bo + b Int/Att bo = b = c. Develop the estimated regression equation that could be used to predict the percentage of games won given the average number of passing yards per attempt and the number of interceptions thrown per attempt (to 1 decimal). Win% = bo + b1 . Yds/Att + b2 . Int/Att bo = b1 = b2 = d. The average number of passing yards per attempt for the Kansas City Chiefs was 6.2 and the number of interceptions thrown per attempt was 0.036. Use the estimated regression equation developed in part (c) to predict the percentage of games won by the Kansas City Chiefs. (Note: For this season the Kansas City Chiefs' record was 7 wins and 9 losses.) Compare your prediction to the actual percentage of games won by the Kansas City Chiefs (to whole number). Predicted percentage Actual percentage Part a. After reading these instruccions delete all text in this shaded area. Use the XLMiner Analysis ToolPak to conduct your Linear Regression analysis. After deleting all text in this shaded area, set the output range in the ToolPak to the top left cell of this area (H2). Your Linear Regression analysis output should fit into this shaded area. 1 Team 2 Arizona Cardinals Atlanta Falcons Carolina Panthers 5 Cincinnati Bengals 6 Detroit Lions 7 Green Bay Packers 8 Houstan Texans 9 Indianapolis Colts 10 Jacksonville Jaguars 11 Minnesota Vikings 12 New England Patriots 13 New Orleans Saints 14 Oakland Raiders 15 San Francisco 49ers 16 Tennessee Titans 17 Washington Redskins 18 19 20 21 22 Conf NFC NFC NFC AFC NFC NFC AFC AFC AFC NFC AFC NFC AFC NFC AFC NFC Yds/Att 6.5 7.1 7.4 6.0 7.1 8.7 7.5 5.5 4.5 5.7 8.2 7.9 7.4 6.6 6.7 6.4 Int/Att 0.043 0.021 0.034 0.025 0.023 0.013 0.020 0.025 0.031 0.032 0.021 0.021 0.044 0.012 0.025 0.041 Win% 50.1 62.6 37.3 56.3 62.2 93.8 62.4 12.3 31.4 18.5 81.3 81.2 50.1 81.0 56.4 31.2 Part b. 24 25 - 2 3 4 seissp=BBUBBEB98328B%T49999mm After reading these instructions delete all text in this shaded area. , Use the XLMiner Analysis ToolPak to conduct your Linear Regression analysis. After deleting all text in this shaded area, set the output range in the ToolPak to the top left cell of this area (H22). Your Linear Regression analysis output should fit into this shaded area. 27 28 29 30 31 32 33 34 35 36 37 38 39 40 41 42 43 44 45 46 47 48 Part c. After reading these instructions delete all text in this shaded area. Use the XLMiner Analysis ToolPak to conduct your Linear Regression analysis After deleting all text in this shaded area, set the output range in the ToolPak to the top left cell of this area (H42). , ) Your Linear Regression analysis output should fit into this shaded area. 50 51 52 Part d. Team Yds/Att Int/Att Wins Losses Kansas City Chiefs 6.2 0.036 7 9 Formula Actual Win% (to whole number) #N/A Predicted Win% (to whole number) #N/A

Step by Step Solution

There are 3 Steps involved in it

1 Expert Approved Answer
Step: 1 Unlock blur-text-image
Question Has Been Solved by an Expert!

Get step-by-step solutions from verified subject matter experts

Step: 2 Unlock
Step: 3 Unlock

Students Have Also Explored These Related General Management Questions!