

Question: Dunkin selects random consumers to analyze smoothie consumption. Use the smoothie consumption data in Excel Template to answer the following questions: Develop a histogram of
Dunkin selects random consumers to analyze smoothie consumption. Use the smoothie consumption data in Excel Template to answer the following questions:
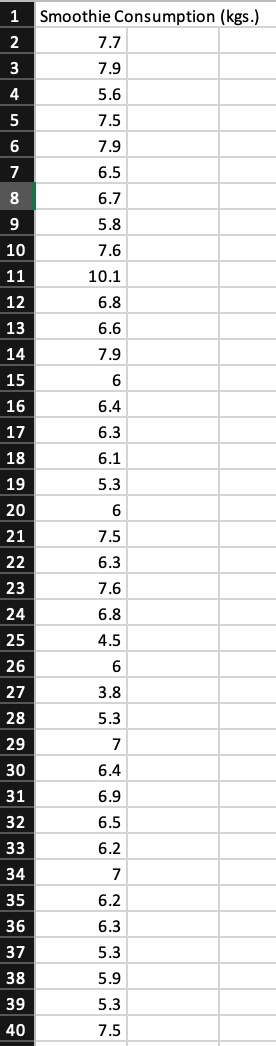
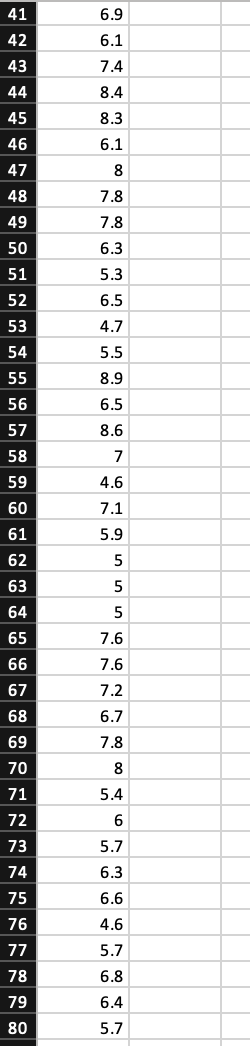
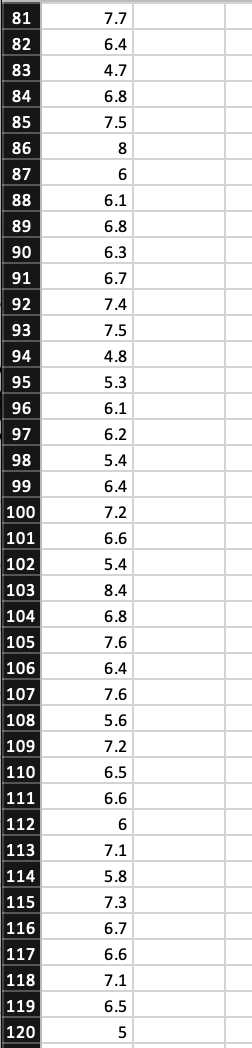
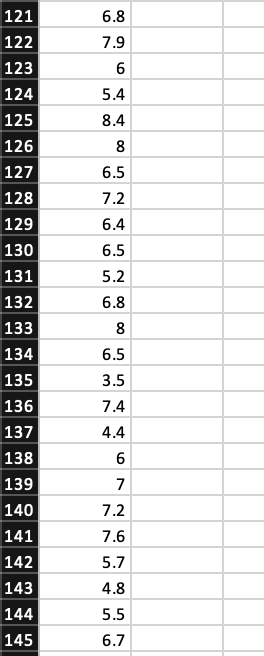
- Develop a histogram of the data. Explain what the histogram depicts.
- Construct a relative and a cumulative relative frequency distribution of the data.
- What percentage of the smoothie drinkers sampled drink 8.0 kg or more annually?
Please solve questions a and b on excel, and show how to do it step-by-step for each question.
1 2 3 Smoothie Consumption (kgs.) 7.7 7.9 5.6 7.5 7.9 4 5 6 7 6.5 8 6.7 9 5.8 10 11 7.6 10.1 6.8 6.6 12 13 14 7.9 15 6 6.4 6.3 6.1 5.3 6 7.5 6.3 7.6 6.8 4.5 6 3.8 16 17 18 19 20 21 22 23 24 25 26 27 28 29 30 31 32 33 34 35 36 37 38 39 40 5.3 7 6.4 6.9 6.5 6.2 7 6.2 6.3 5.3 5.9 5.3 7.5 41 6.9 42 43 6.1 7.4 44 45 8.4 8.3 6.1 46 47 48 8 49 50 7.8 7.8 6.3 5.3 6.5 4.7 5.5 8.9 6.5 51 52 53 54 55 56 57 58 59 60 61 62 63 8.6 7 4.6 7.1 5.9 5 5 64 65 5 7.6 7.6 66 67 7.2 6.7 7.8 8 68 69 70 71 72 73 74 75 76 77 78 79 80 5.4 6 5.7 6.3 6.6 4.6 5.7 6.8 6.4 5.7 81 7.7 82 6.4 4.7 83 84 6.8 7.5 85 86 8 87 6 6.1 88 89 6.8 90 6.3 6.7 91 92 7.4 7.5 93 94 4.8 95 5.3 96 6.1 97 6.2 98 5.4 99 6.4 7.2 6.6 100 101 102 103 5.4 8.4 104 6.8 7.6 105 106 6.4 7.6 107 108 5.6 109 7.2 110 6.5 111 6.6 112 6 113 7.1 5.8 114 115 7.3 6.7 116 117 6.6 118 7.1 119 6.5 120 5 121 122 123 124 125 126 127 128 129 130 131 132 133 134 135 136 137 138 139 140 141 142 143 144 145 6.8 7.9 6 5.4 8.4 8 6.5 7.2 6.4 6.5 5.2 6.8 8 6.5 3.5 7.4 4.4 6 7 7.2 7.6 5.7 4.8 5.5 6.7 8Step by Step Solution
There are 3 Steps involved in it
1 Expert Approved Answer
Step: 1 Unlock

Question Has Been Solved by an Expert!
Get step-by-step solutions from verified subject matter experts
Step: 2 Unlock
Step: 3 Unlock