

Question: During the exam you will be using a sample of 500 adults with the following variables: . genhelf - variable recording general self-reported health coded
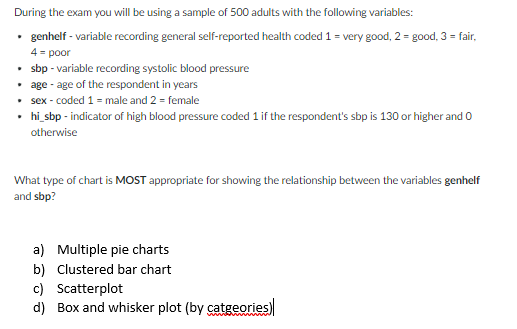
During the exam you will be using a sample of 500 adults with the following variables: . genhelf - variable recording general self-reported health coded 1 = very good, 2 = good, 3 = fair, 4 = poor . sbp - variable recording systolic blood pressure . age - age of the respondent in years . sex - coded 1 = male and 2 = female . hi_sbp - indicator of high blood pressure coded 1 if the respondent's sbp is 130 or higher and O otherwise What type of chart is MOST appropriate for showing the relationship between the variables genhelf and sbp? a) Multiple pie charts b) Clustered bar chart c) Scatterplot d) Box and whisker plot (by catgeories)
Step by Step Solution
There are 3 Steps involved in it

Get step-by-step solutions from verified subject matter experts