

Question: Please sir answer... During the exam you will be using a sample of 500 adults with the following variables: genhelf - variable recording general self-reported
Please sir answer...

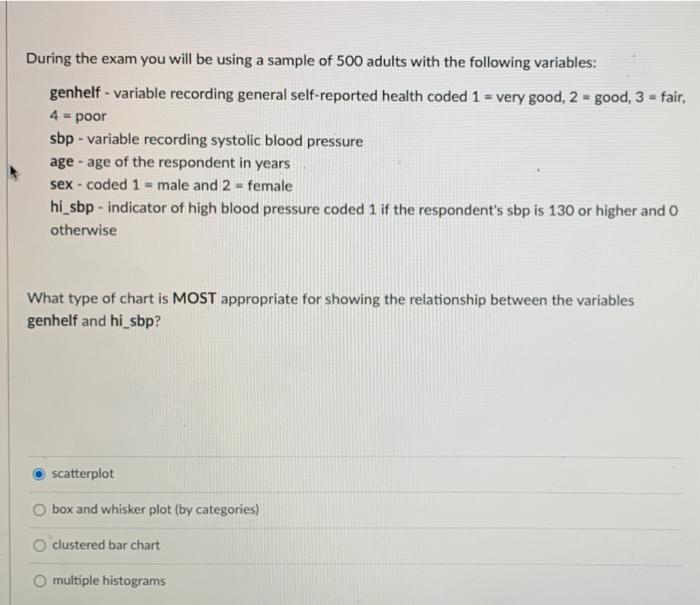
During the exam you will be using a sample of 500 adults with the following variables: genhelf - variable recording general self-reported health coded 1 = very good, 2 = good, 3 = fair, 4 - poor sbp - variable recording systolic blood pressure age - age of the respondent in years sex - coded 1 = male and 2 = female hi_sbp - indicator of high blood pressure coded 1 if the respondent's sbp is 130 or higher and 0 otherwise What type of chart is MOST appropriate for showing the relationship between the variables genhelf and hi_sbp? scatterplot O box and whisker plot (by categories) clustered bar chart O multiple histograms
Step by Step Solution
There are 3 Steps involved in it
1 Expert Approved Answer
Step: 1 Unlock

Question Has Been Solved by an Expert!
Get step-by-step solutions from verified subject matter experts
Step: 2 Unlock
Step: 3 Unlock