

Question: Dynamic AS-AD model. The current recession caused by the COVID-19 pandemic has reduced demand for Australian goods. Your task is to understand how this
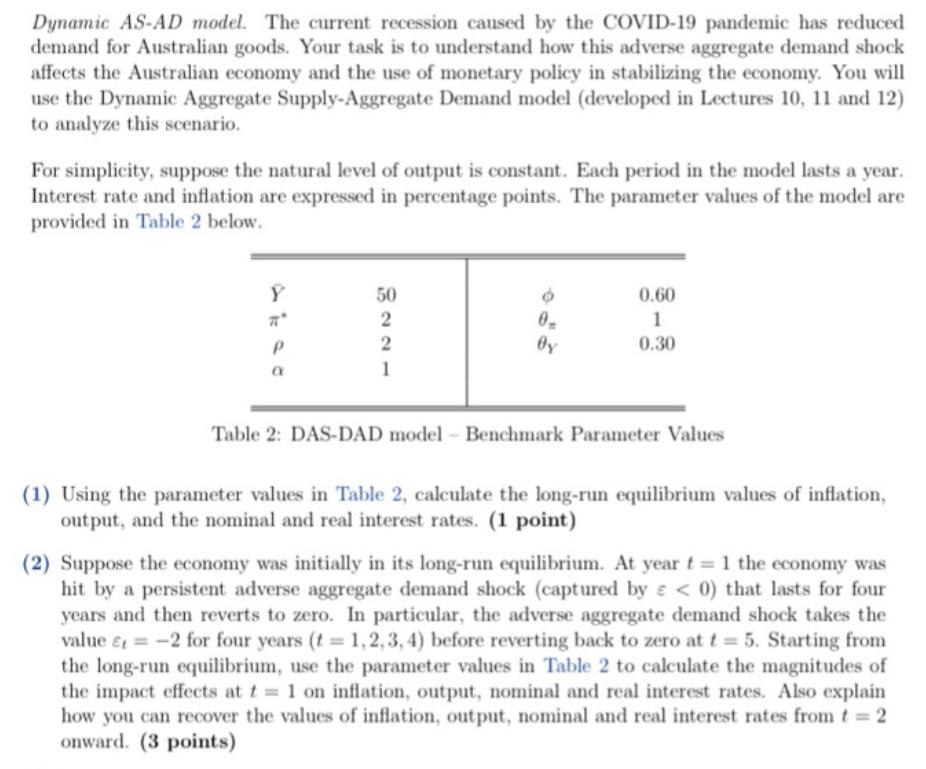
Dynamic AS-AD model. The current recession caused by the COVID-19 pandemic has reduced demand for Australian goods. Your task is to understand how this adverse aggregate demand shock affects the Australian economy and the use of monetary policy in stabilizing the economy. You will use the Dynamic Aggregate Supply-Aggregate Demand model (developed in Lectures 10, 11 and 12) to analyze this scenario. For simplicity, suppose the natural level of output is constant. Each period in the model lasts a year. Interest rate and inflation are expressed in percentage points. The parameter values of the model are provided in Table 2 below. 50 0.60 1 Oy 0.30 1 a Table 2: DAS-DAD model Benchmark Parameter Values (1) Using the parameter values in Table 2, calculate the long-run equilibrium values of inflation, output, and the nominal and real interest rates. (1 point) (2) Suppose the economy was initially in its long-run equilibrium. At year t 1 the economy was hit by a persistent adverse aggregate demand shock (captured by e < 0) that lasts for four years and then reverts to zero. In particular, the adverse aggregate demand shock takes the value e = -2 for four years (t= 1,2,3, 4) before reverting back to zero at t = 5. Starting from the long-run equilibrium, use the parameter values in Table 2 to calculate the magnitudes of the impact effects at t 1 on inflation, output, nominal and real interest rates. Also explain how you can recover the values of inflation, output, nominal and real interest rates from t = 2 onward. (3 points) (3) Now use a spreadsheet to calculate and plot the time paths of inflation, output, nominal and real interest rates for 50 years after the initial demand shock (t = 0, 1, ... , 50). Describe inflation, output, nominal and real interest rate dynamics associated with this adverse aggregate demand shock. Explain how monetary policy responds to the inflation and output gaps. (3 points) (4) Suppose the RBA decides to respond more aggressively to output gap by setting 0, 0.3 and Oy = 1. Keeping all other parameters as in Table 2, recompute the time paths of output, inflation, nominal and real interest rates for 50 years after the initial demand shock (t = 0, 1,.. , 50). Explain how the policy change affects the time paths of inflation, output, nominal and real interest rate. Is there a policy tradeoff between inflation and output? Explain. (3 points) For the remainder of this question consider the implications of a modified version of the dynamic AS-AD model, where people's inflationexpectations may be subject to random shocks. (5) Suppose that people's expectations of inflation are subject to random shocks. That is, instead of being merely adaptive, expected inflation in period t, as seen in period t- 1, is E,-1(7) = 7-1 + M-1, where m-1 is a random shock. This shock is normally zero, but it deviates from zero when some event beyond past inflation causes expected inflation to change. Similarly, E (Tt+1) = 7 + Nt. Derive both the DAD and the DAS equations in this slightly more general model. (3 points) (6) Following part (5), suppose that the economy experiences an inflation scare. That is, at year t = 1, for some reason, people come to believe that inflation in year t = 1 is going to be higher, so n 1 for this year only. Starting in the long-run equilibrium, use the parameter values in Table 2 and the new DAD and DAS equations to calculate and plot the time paths of inflation, output, nominal and real interest rates for 50 years after the inflation expectation shock hits the economy (assuming no other shocks). In what sense are inflation scares self-fulling? Explain.
Step by Step Solution
3.53 Rating (163 Votes )
There are 3 Steps involved in it
1 Equilibrium mves u frm E t E 2 Infltin rte inreses frm 0 t 2 But utut level dereses frm Y 0 t Y 2 Thus inrese in exeted rte f infltin e r dverse suly shk uses higher infltin nd lwer utut level knwn ... View full answer

Get step-by-step solutions from verified subject matter experts