

Question: e 5. Again for the table below, assume the probabilities for the different economic scenarios to the following. Severe Recession probability = 10%, Mild Recession
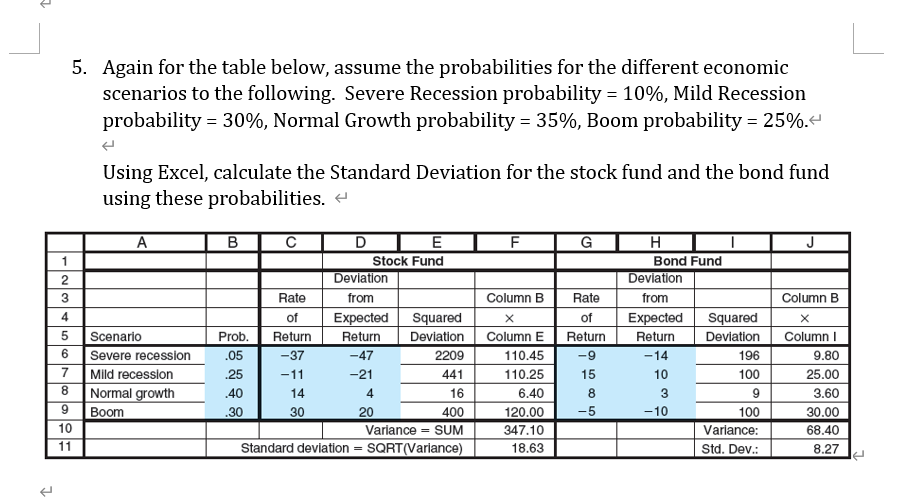
e 5. Again for the table below, assume the probabilities for the different economic scenarios to the following. Severe Recession probability = 10%, Mild Recession probability = 30%, Normal Growth probability = 35%, Boom probability = 25%. Using Excel, calculate the Standard Deviation for the stock fund and the bond fund using these probabilities. A F G 1 2 3 RAWN 4 5 6 B CI D E Stock Fund Deviation Rate from of Expected Squared Prob. Return Return Deviation .05 -37 -47 2209 .25 -11 -21 441 .40 14 4 16 .30 30 20 400 Variance = SUM Standard deviation = SQRT(Variance) Scenario Severe recession Mild recession Normal growth Boom Column B x Column E 110.45 110.25 6.40 120.00 347.10 18.63 Rate of Return -9 15 8 7 H Bond Fund Deviation from Expected Squared Return Deviation -14 196 10 100 3 9 -10 100 Variance: Std. Dev.: Column B X Column 9.80 25.00 3.60 30.00 68.40 8.27 8 loo -5 9 10 11 =
Step by Step Solution
There are 3 Steps involved in it

Get step-by-step solutions from verified subject matter experts