

Question: E Homework: HW #3: Ch Question 8, 2.2.12 HW Score: 35%, 7 of 20 points Save 2.2 (Copy) Part 1 of 2 Score: 0 of
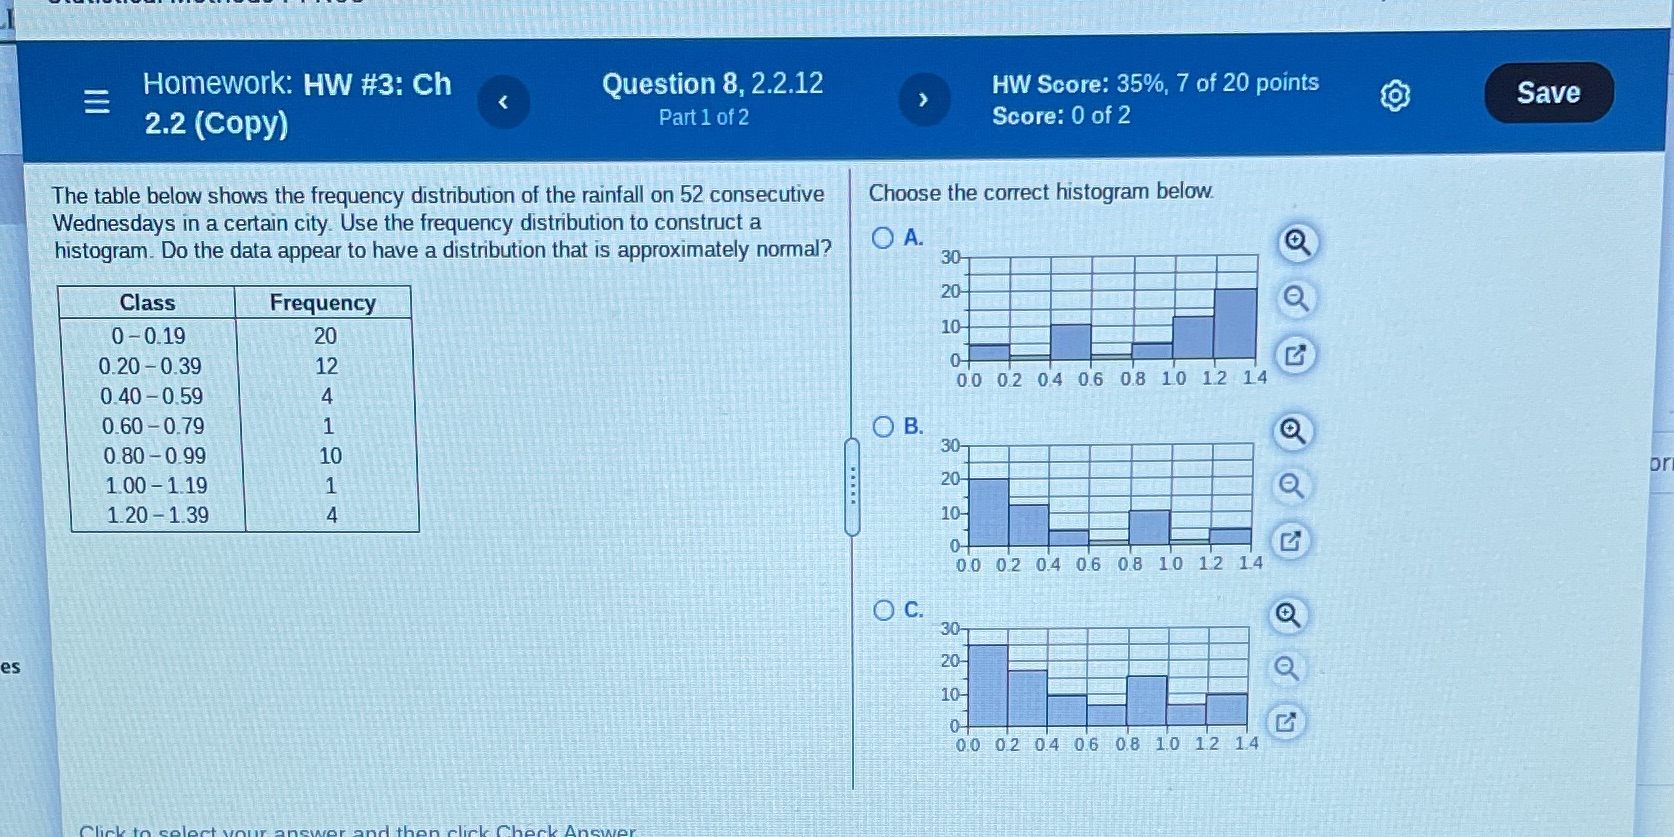
E Homework: HW #3: Ch Question 8, 2.2.12 HW Score: 35%, 7 of 20 points Save 2.2 (Copy) Part 1 of 2 Score: 0 of 2 The table below shows the frequency distribution of the rainfall on 52 consecutive Choose the correct histogram below. Wednesdays in a certain city. Use the frequency distribution to construct a histogram. Do the data appear to have a distribution that is approximately normal? O A. O 30- Class Frequency 20- 0 -0.19 20 10 0.20 - 0.39 12 O- 0.0 02 04 06 0.8 10 12 14 0.40 -0.59 4 0.60-0.79 1 O B. 0.80-0.99 10 30 20- or 100 -1.19 1.20 -1.39 10- 0.0 02 04 06 08 10 12 14 O C. 30- es 20- 10- 0- 0.0 02 04 06 0.8 10 12 14
Step by Step Solution
There are 3 Steps involved in it
1 Expert Approved Answer
Step: 1 Unlock

Question Has Been Solved by an Expert!
Get step-by-step solutions from verified subject matter experts
Step: 2 Unlock
Step: 3 Unlock