

Question: that is the other part the chart Statistical Methods I E Homework: HW #3: Ch Question 7, 2.2.11-E HW Score: 15%, 3 of 20 points
that is the other part the chart
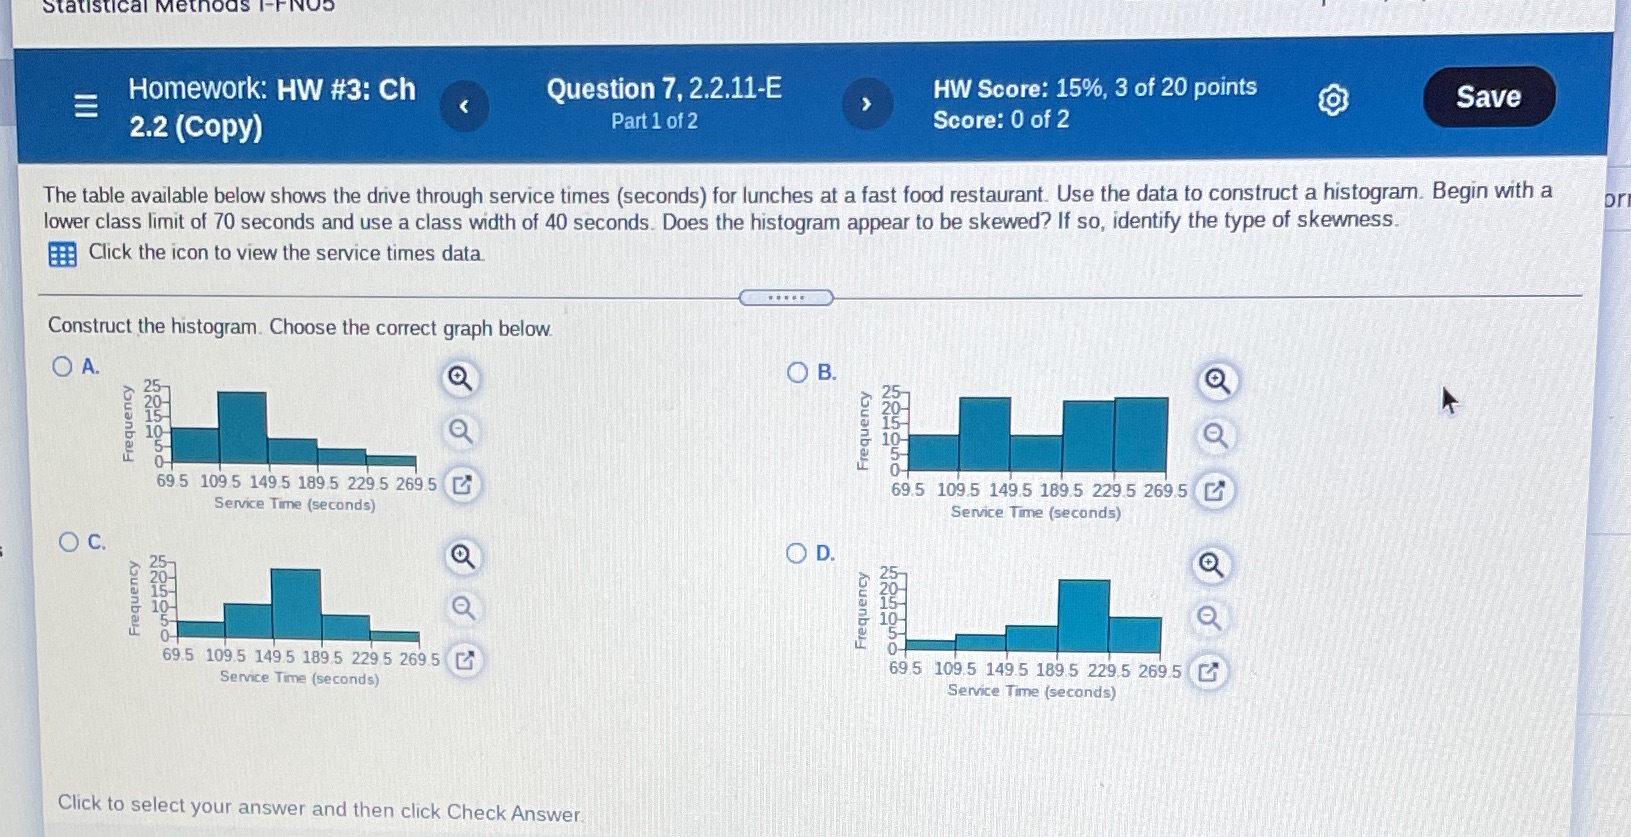
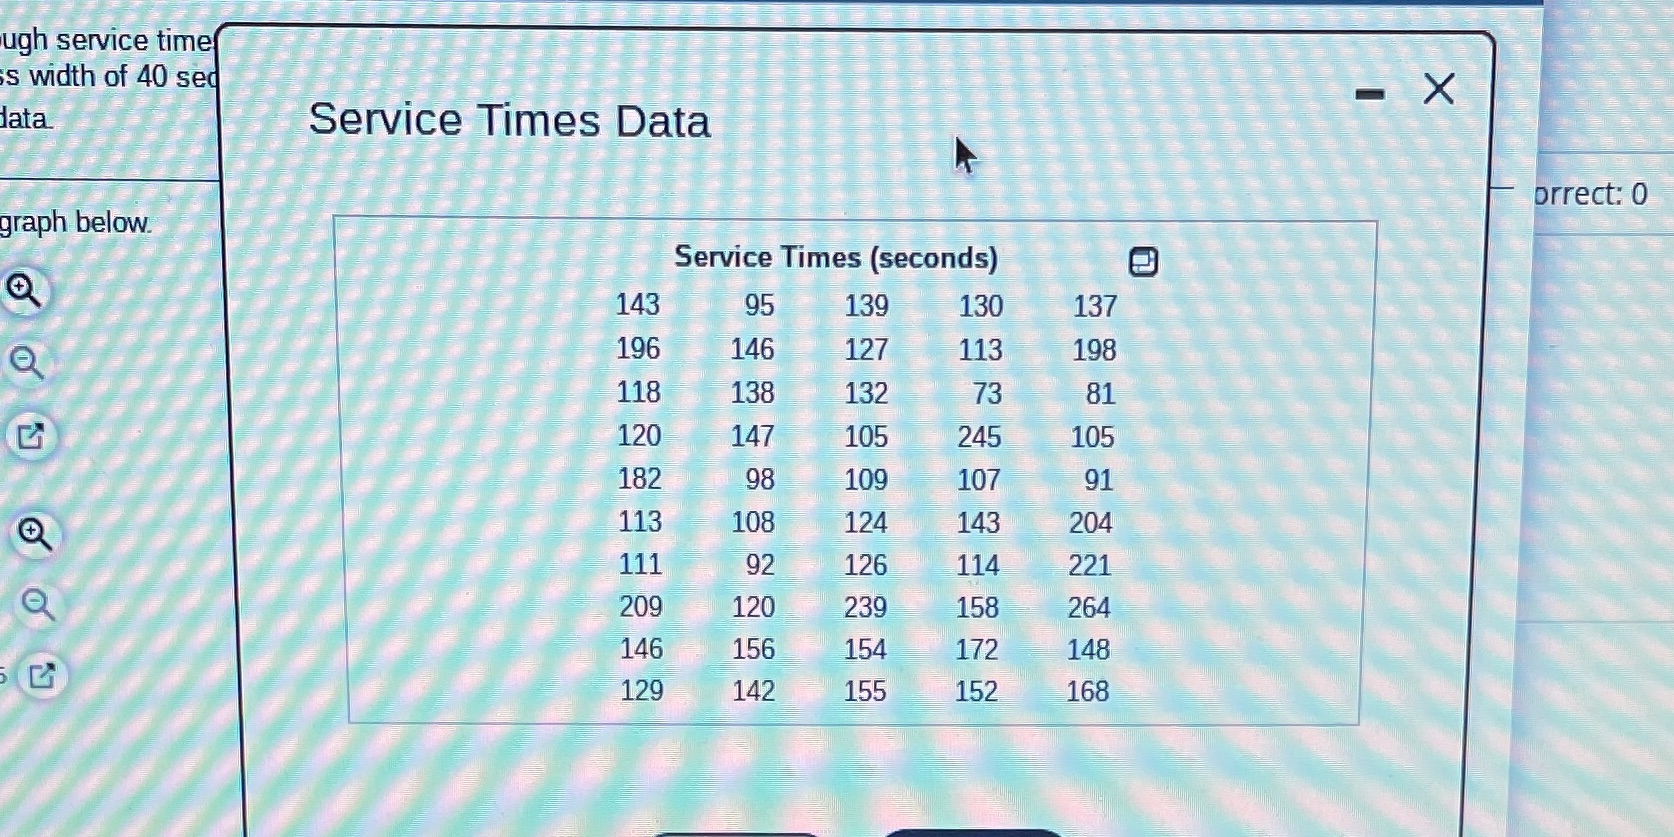
Statistical Methods I E Homework: HW #3: Ch Question 7, 2.2.11-E HW Score: 15%, 3 of 20 points O Save 2.2 (copy) Part 1 of 2 Score: 0 of 2 The table available below shows the drive through service times (seconds) for lunches at a fast food restaurant. Use the data to construct a histogram. Begin with a or lower class limit of 70 seconds and use a class width of 40 seconds. Does the histogram appear to be skewed? If so, identify the type of skewness. Click the icon to view the service times data. Construct the histogram. Choose the correct graph below. O A. OB. Frequency Frequency 69 5 109 5 149.5 189 5 229.5 269 5 69.5 109.5 149.5 189.5 229.5 269.5 Service Time (seconds) Service Time (seconds) O C. OD. Frequency Frequency 69.5 1095 149 5 189 5 229 5 269.5 Service Time (seconds) 69.5 109.5 149.5 189.5 229.5 269.5 Service Time (seconds) Click to select your answer and then click Check Answer.\f
Step by Step Solution
There are 3 Steps involved in it

Get step-by-step solutions from verified subject matter experts