

Question: E Homework: Section 4.2 Question 1, 4.2.13 HW Score: 0%, 0 of 11 points Activity Homework Part 3 of 4 Points: 0 of 4 Save
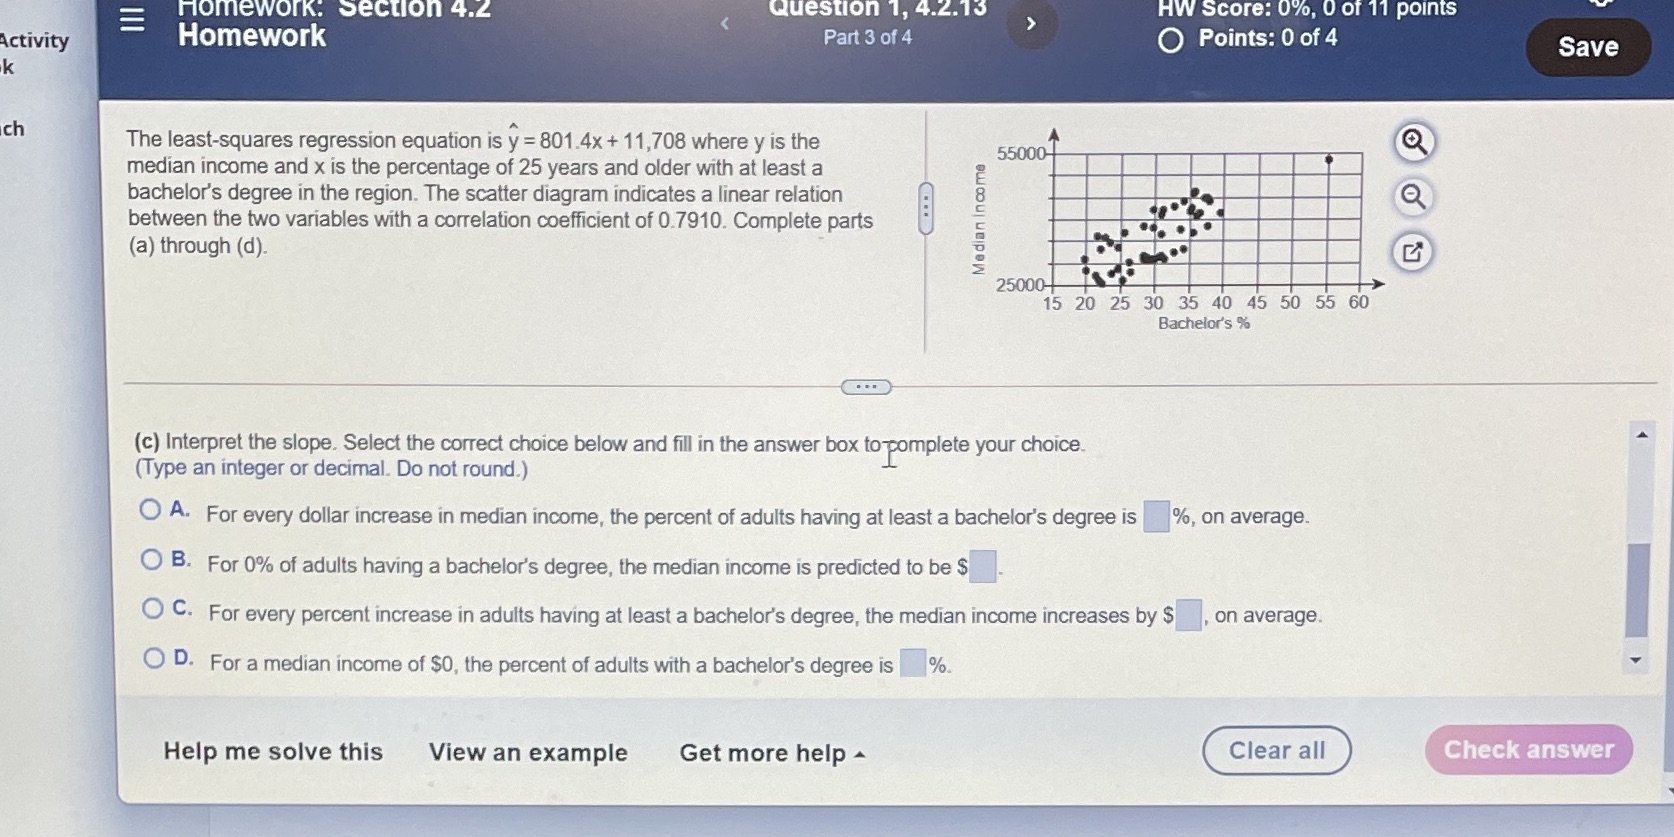
E Homework: Section 4.2 Question 1, 4.2.13 HW Score: 0%, 0 of 11 points Activity Homework Part 3 of 4 Points: 0 of 4 Save k ch The least-squares regression equation is y = 801.4x + 11,708 where y is the 55000- median income and x is the percentage of 25 years and older with at least a bachelor's degree in the region. The scatter diagram indicates a linear relation between the two variables with a correlation coefficient of 0.7910. Complete parts Median Income (a) through (d). 25000- 15 20 25 30 35 40 45 50 55 60 Bachelor's % . . . (c) Interpret the slope. Select the correct choice below and fill in the answer box to pomplete your choice. (Type an integer or decimal. Do not round.) O A. For every dollar increase in median income, the percent of adults having at least a bachelor's degree is %, on average. O B. For 0% of adults having a bachelor's degree, the median income is predicted to be $ O C. For every percent increase in adults having at least a bachelor's degree, the median income increases by $ , on average. O D. For a median income of $0, the percent of adults with a bachelor's degree is %. Help me solve this View an example Get more help Clear all Check
Step by Step Solution
There are 3 Steps involved in it

Get step-by-step solutions from verified subject matter experts