

Question: Resources Homework: Section 4.2 Question 1, 4.2.13 HW Score: 0%, 0 of 11 points t Activity Homework Part 2 of 4 O Points: 0 of
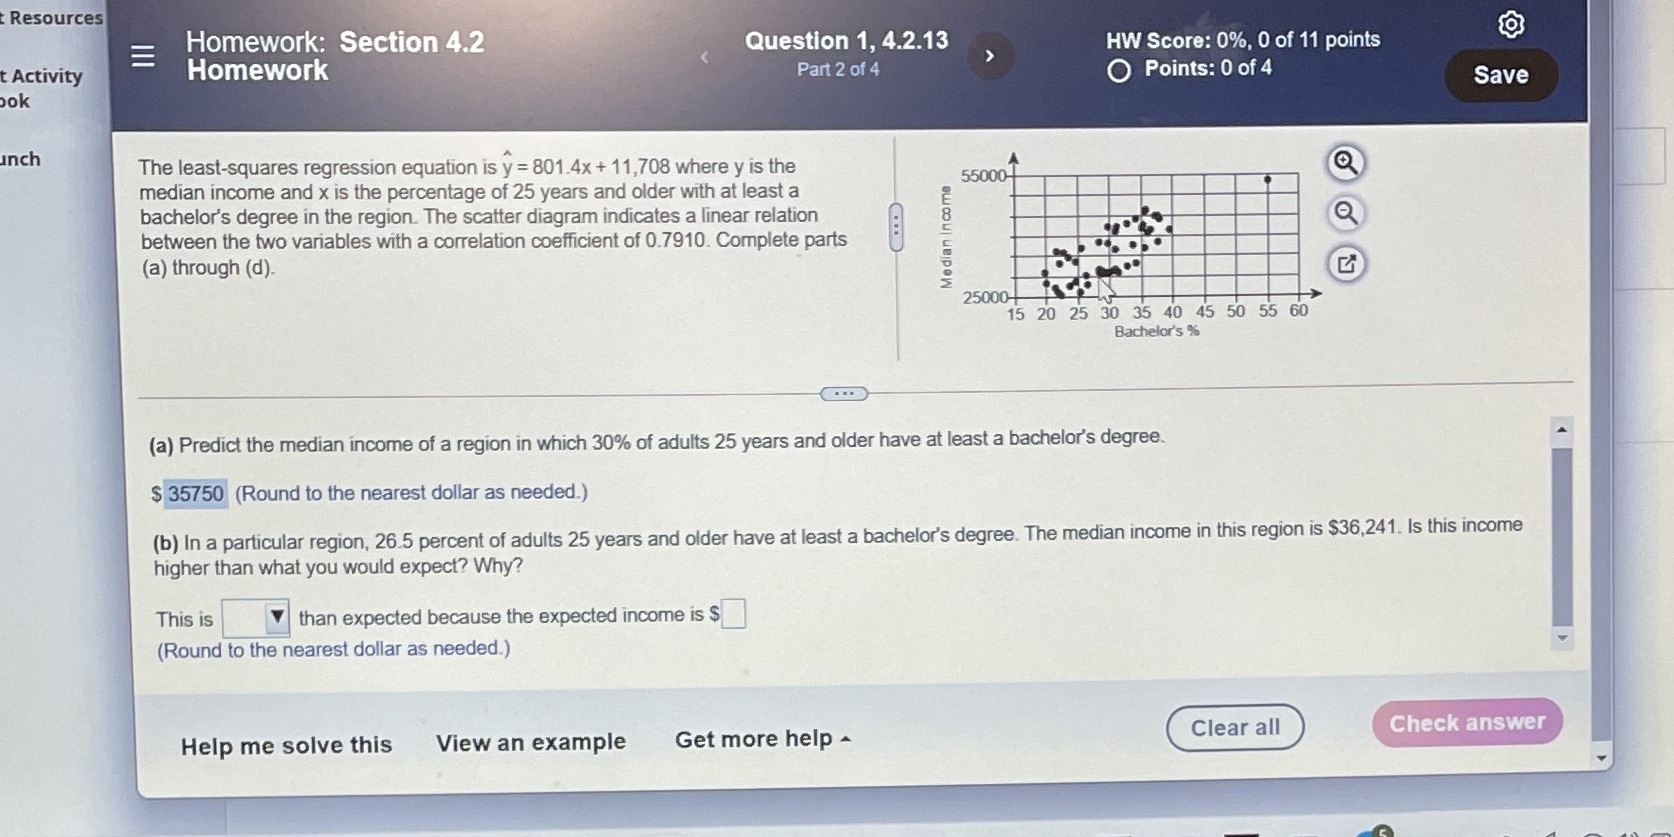
Resources Homework: Section 4.2 Question 1, 4.2.13 HW Score: 0%, 0 of 11 points t Activity Homework Part 2 of 4 O Points: 0 of 4 Save bok Inch The least-squares regression equation is y = 801.4x + 11,708 where y is the 55000- median income and x is the percentage of 25 years and older with at least a bachelor's degree in the region. The scatter diagram indicates a linear relation between the two variables with a correlation coefficient of 0.7910. Complete parts Median Income (a) through (d). 25000 KGON 15 20 25 30 35 40 45 50 55 60 Bachelor's % (a) Predict the median income of a region in which 30% of adults 25 years and older have at least a bachelor's degree. $ 35750 (Round to the nearest dollar as needed.) (b) In a particular region, 26.5 percent of adults 25 years and older have at least a bachelor's degree. The median income in this region is $36,241. Is this income higher than what you would expect? Why? This is than expected because the expected income is $ (Round to the nearest dollar as needed.) Help me solve this View an example Get more help - Clear all Check
Step by Step Solution
There are 3 Steps involved in it

Get step-by-step solutions from verified subject matter experts