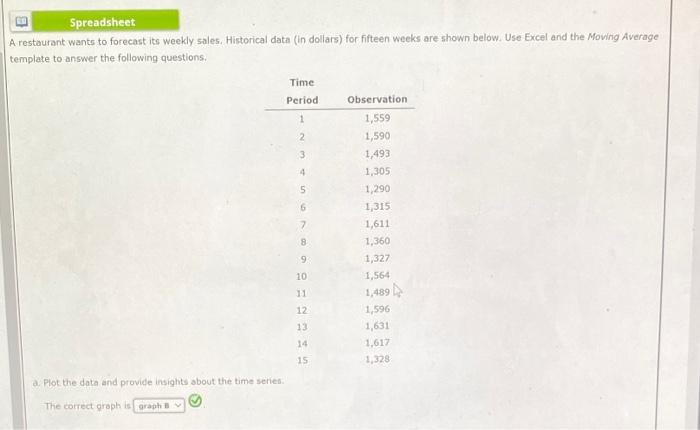
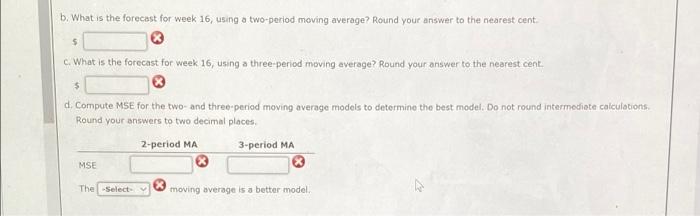
Question: E Spreadsheet A restaurant wants to forecast its weekly sales. Historical data (in dollars) for fifteen weeks are shown below. Use Excel and the Moving

E Spreadsheet A restaurant wants to forecast its
E Spreadsheet A restaurant wants to forecast its weekly sales. Historical data (in dollars) for fifteen weeks are shown below. Use Excel and the Moving Average template to answer the following questions, Time Period Observation 1 2 3 4 5 G 7 8 1,559 1,590 1,493 1,305 1,290 1,315 1,611 1,360 1,327 1,564 1,489 1.596 1,631 1,617 1,328 9 10 11 12 13 14 15 a Plot the date and provide insights about the time series The correct graph is graph b. What is the forecast for week 16, using a two-perlod moving average? Round your answer to the nearest cent. 5 c. What is the forecast for week 16, using a three-period moving average? Round your answer to the nearest cent $ d. Compute MSE for the two- and three period moving average models to determine the best model. Do not round intermediate calculations Round your answers to two decimal places 2-period MA 3-period MA MSE The Select moving average is a better model

Step by Step Solution

There are 3 Steps involved in it

1 Expert Approved Answer
Step: 1 Unlock blur-text-image
Question Has Been Solved by an Expert!

Get step-by-step solutions from verified subject matter experts

Step: 2 Unlock
Step: 3 Unlock

Students Have Also Explored These Related General Management Questions!