

Question: It's all one question. Please have an expert solve this problem as I have been posting questions lately that have been wrong or not finished.
It's all one question. Please have an expert solve this problem as I have been posting questions lately that have been wrong or not finished. Thank you. 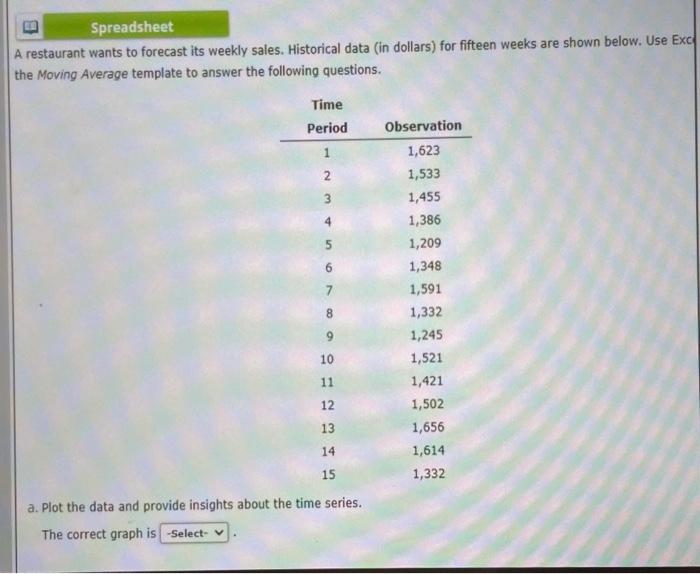
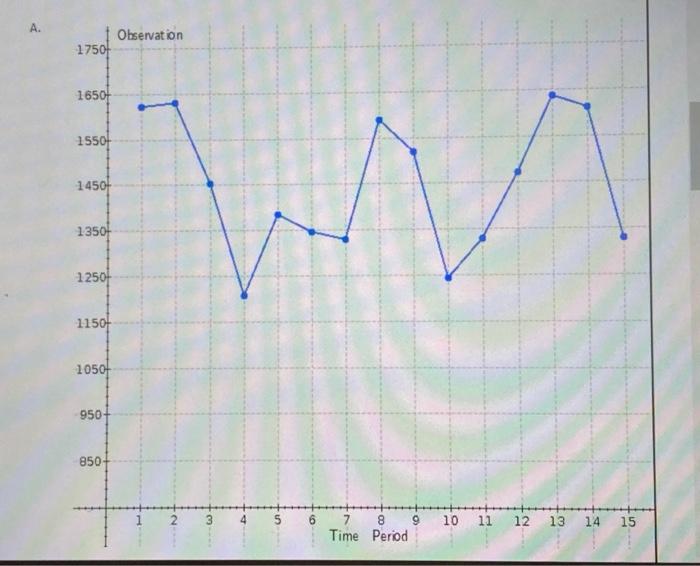
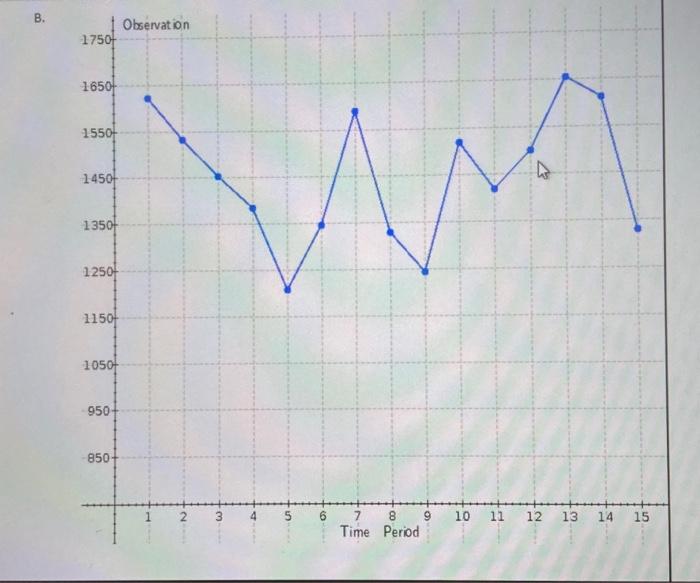
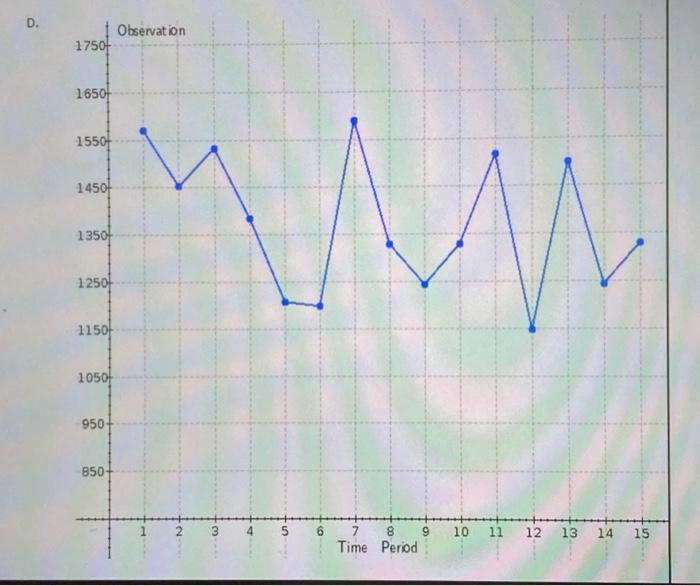
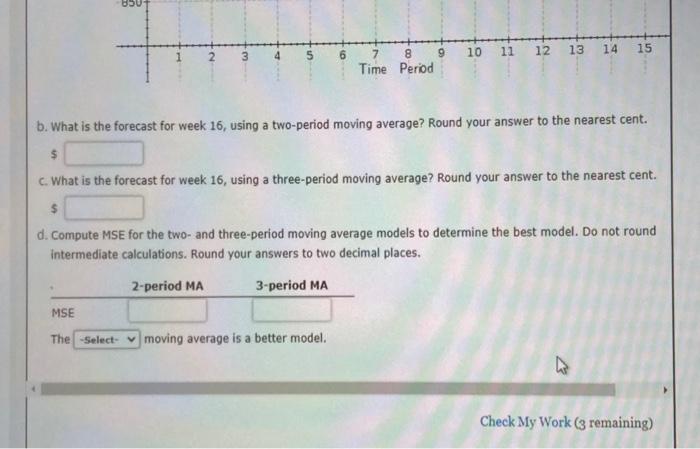
Spreadsheet A restaurant wants to forecast its weekly sales. Historical data (in dollars) for fifteen weeks are shown below. Use Exc the Moving Average template to answer the following questions. Time Period 2 3 4 6 7 Observation 1,623 1,533 1,455 1,386 1,209 1,348 1,591 1,332 1,245 1,521 1,421 1,502 1,656 1,614 1,332 8 9 10 11 12 13 14 15 a. Plot the data and provide insights about the time series. The correct graph is -Select- Observation 17501 1650 15501 1450+ w 13507 12501 1150+ 10507 950 850 4 10 11 12 13 14 15 Time Period B. Observation 17507 16501 15501 1450 mu 13507 1250+ 1501 1050 950 850- 2 3 6 8 9 Time Period 10 11 12 13 14 15 C. Observation 17507 16501 15507 1450+ w 13501 1250 1150 1050+ 950 850- 2 3 4 5 6 10 11 12 13 14 15 7 8 Time Period D. Observation 1750+ 16501 15507 1450+ w M 13507 1250 11507 10504 950+ 850+ 3 4 5 6 10 12 12 13 14 8 9 Time Period 15 350 O 10 11 12 13 14 15 7 8 Time Period b. What is the forecast for week 16, using a two-period moving average? Round your answer to the nearest cent. $ c. What is the forecast for week 16, using a three-period moving average? Round your answer to the nearest cent. d. Compute MSE for the two- and three-period moving average models to determine the best model. Do not round intermediate calculations. Round your answers to two decimal places. 2-period MA 3-period MA MSE The Select v moving average is a better model. Check My Work (3 remaining)
Step by Step Solution
There are 3 Steps involved in it
1 Expert Approved Answer
Step: 1 Unlock

Question Has Been Solved by an Expert!
Get step-by-step solutions from verified subject matter experts
Step: 2 Unlock
Step: 3 Unlock