

Question: e the graphing utility to plot the graph of y tan y 2 0 052 2 8 y 2 45 2 1 1 75 1
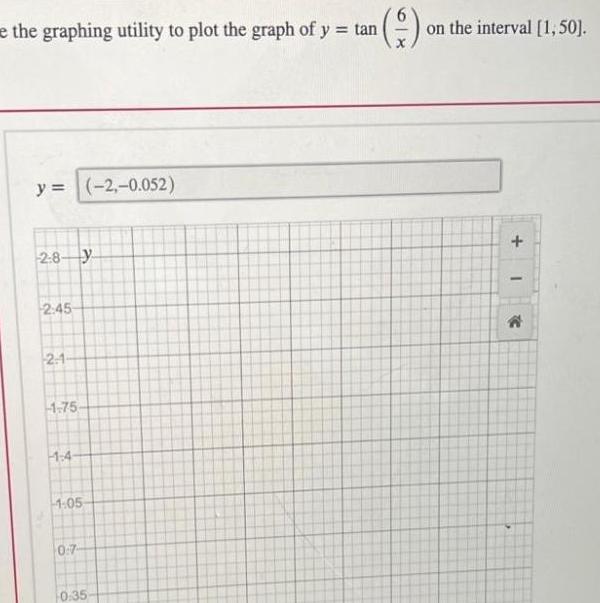

e the graphing utility to plot the graph of y tan y 2 0 052 2 8 y 2 45 2 1 1 75 1 4 1 05 0 7 0 35 on the interval 1 50 I R
Step by Step Solution
There are 3 Steps involved in it
1 Expert Approved Answer
Step: 1 Unlock

Question Has Been Solved by an Expert!
Get step-by-step solutions from verified subject matter experts
Step: 2 Unlock
Step: 3 Unlock