

Question: E2 F E D K A B Q5. Create scatterplot uisng Table 5. Table 5 Hours Studied = x Test Score=y 2 3 4 5
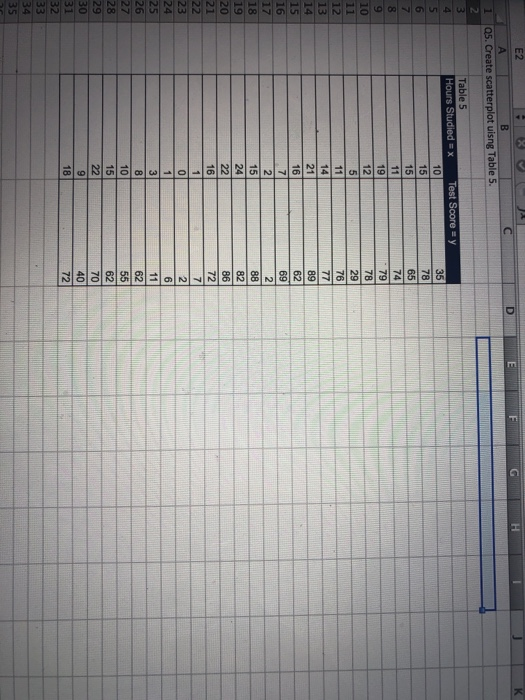
E2 F E D K A B Q5. Create scatterplot uisng Table 5. Table 5 Hours Studied = x Test Score=y 2 3 4 5 6 7 8 9 10 11 12 13 14 15 16 17 18 19 20 21 22 23 24 25 26 27 28 29 30 31 32 33 34 35 10 15 15 11 19 12 5 11 14 21 16 7 2 15 24 22 16 1 0 1 3 8 10 15 22 9 18 35 78 65 74 79 78 29 76 77 89 62 69 2 88 82 86 72 7 2 6 11 62 55 62 70 40 72
Step by Step Solution
There are 3 Steps involved in it
1 Expert Approved Answer
Step: 1 Unlock

Question Has Been Solved by an Expert!
Get step-by-step solutions from verified subject matter experts
Step: 2 Unlock
Step: 3 Unlock