

Question: E9-14 Computing and Interpreting the Fixed Asset Turnover Ratio from a Financial Analysts Perspective [LO 9-7] The following data were included in a recent Papaya
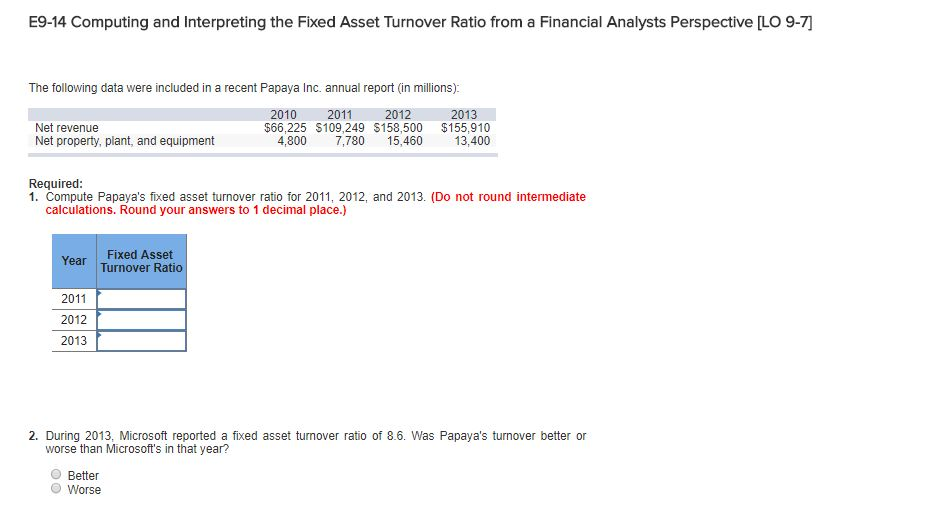
E9-14 Computing and Interpreting the Fixed Asset Turnover Ratio from a Financial Analysts Perspective [LO 9-7] The following data were included in a recent Papaya Inc. annual report (in millions): 2010 2011 2012 $66,225 $109,249 $158,500 $155,910 2013 Net revenue Net property, plant, and equipment 4,800 7,780 15,460 13,400 Required: 1. Compute Papaya's fixed asset turnover ratio for 2011, 2012, and 2013. (Do not round intermediate calculations. Round your answers to 1 decimal place.) Year Fixed Asset Turnover Ratio 2011 2012 2013 2. During 2013, Microsoft reported a fixed asset turnover ratio of 8.6. Was Papaya's turnover better or worse than Microsofts in that year? Better Worse
Step by Step Solution
There are 3 Steps involved in it

Get step-by-step solutions from verified subject matter experts