

Question: each chart interpret the data,, PIE chart Bar chart Line chart Below e each chart, write down brief descriptions/highlights or the key information contained in
each chart interpret the data,,
- PIE chart
- Bar chart
- Line chart Below e
- each chart, write down brief descriptions/highlights or the key information contained in the chart. For example, you can describe the trend (increasing or decreasing?), the highest amount or the month of the highest amount, etc. You should provide at least two highlights for each chart. You can use the following questions as your guide in identifying which information to highlight. Of course, feel free to go beyond these. i. What is the trend of sales, expenses, or net income in the first four months of operation? ii. Which expense is the highest/lowest for November? iii. Which ice cream type sells more?
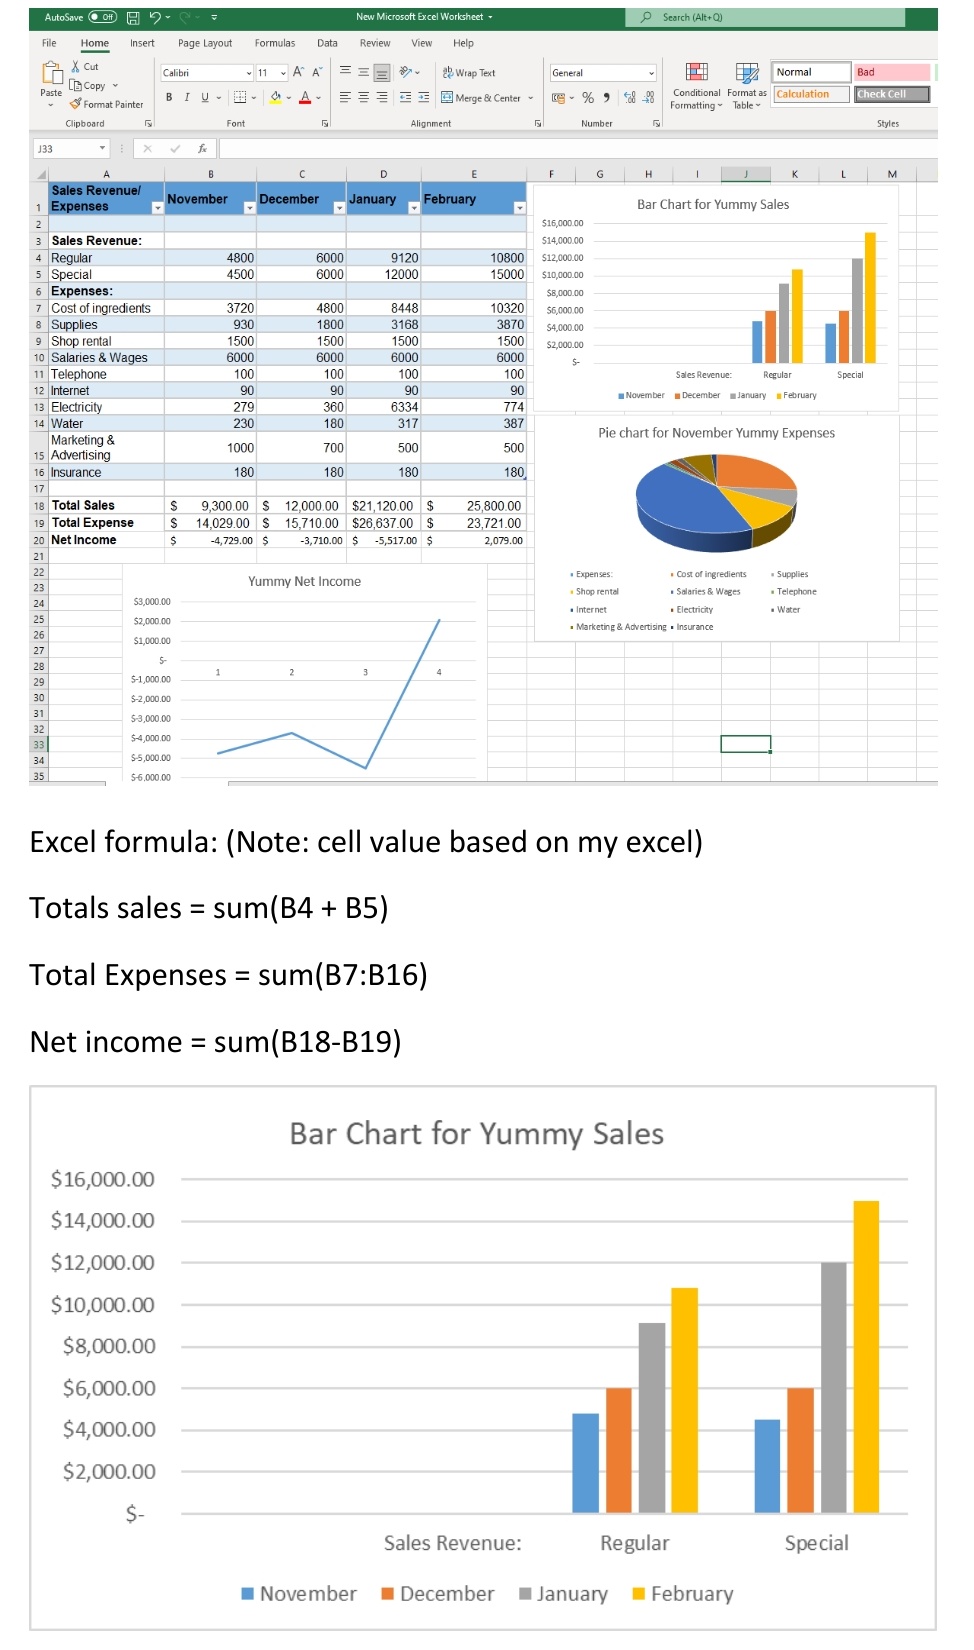
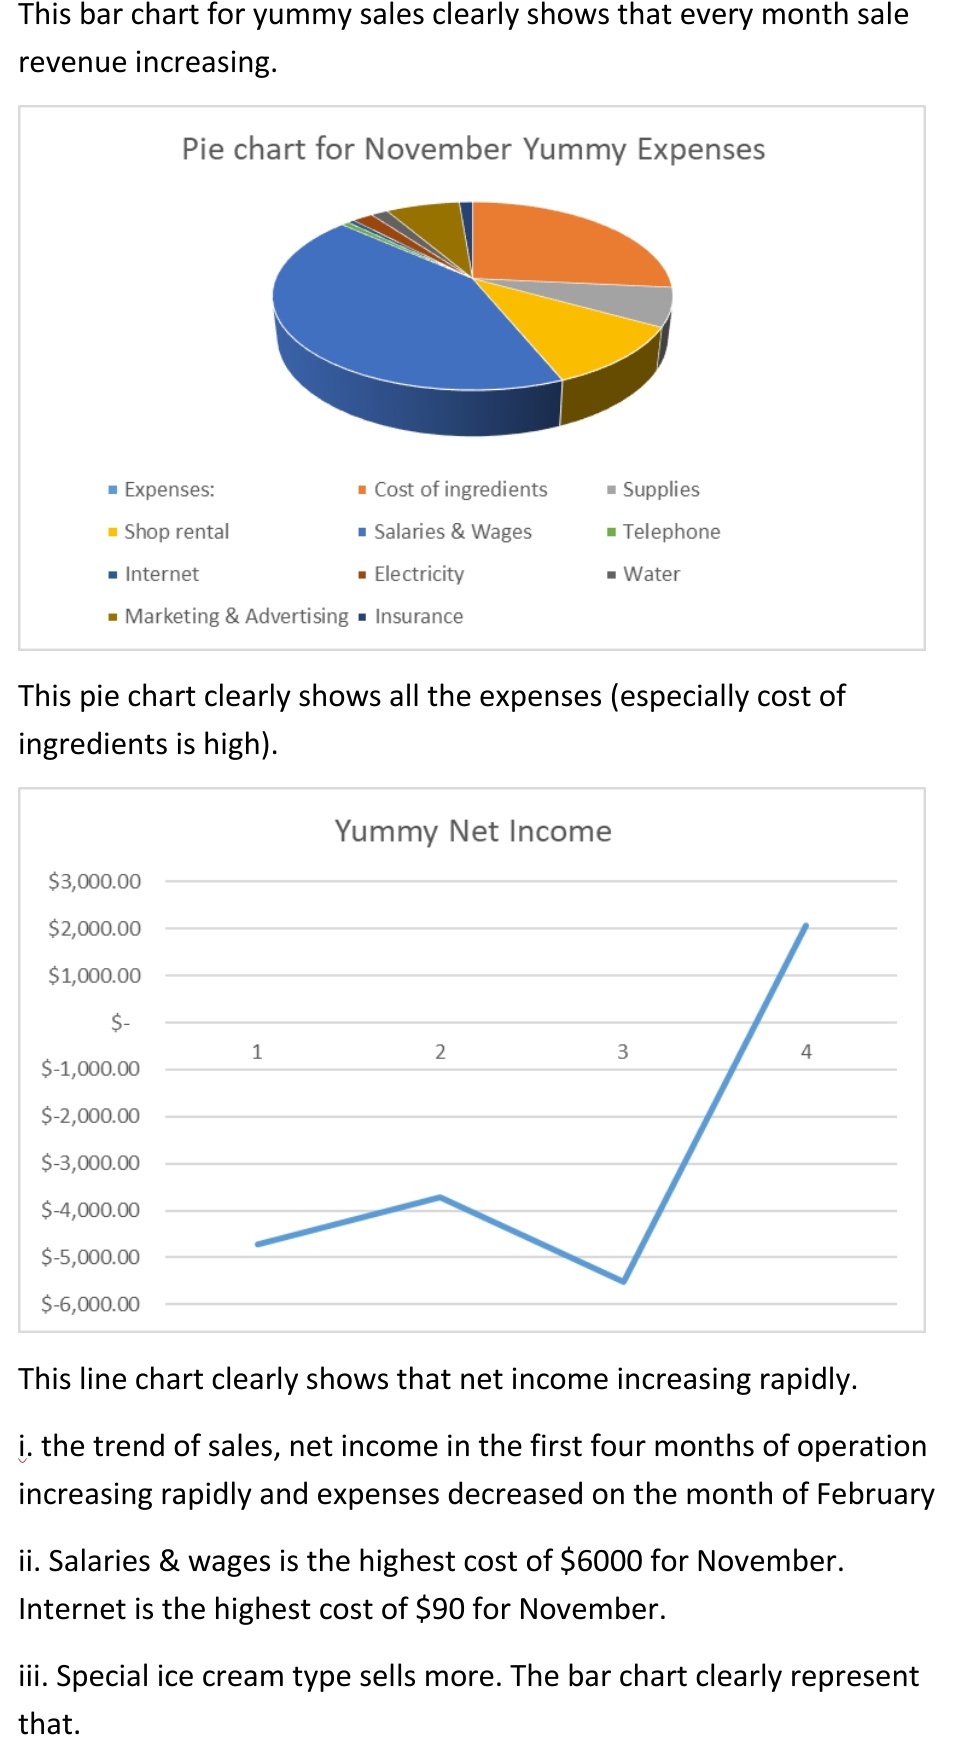
AutoSave ( Off) - New Microsoft Excel Worksheet . Search (Alt+ Q) File Home Insert Page Layout Formulas Data Review View Help X Cut Calibri 11 AA = = = 2h Wrap Text General Normal Bad Paste [B) Copy BIU - - d-A~ Merge & Center " Conditional Format as Calculation Check Cell Format Painter Formatting ~ Table Clipboard Alignment Number Style J33 X vfox D G H L M Sales Revenuel November December January February 1 Expenses Bar Chart for Yummy Sales $16,000.00 N 3 Sales Revenue: $14,000.00 4 Regular 4800 6000 9120 10800 $12,000.00 Specia 4500 6000 12000 15000 $10,000.00 6 Expenses: $8,000.00 7 Cost of ingredients 3720 4800 8448 10320 $6,000.0 8 Supplies 930 1800 3168 3870 $4,000.00 9 Shop rental 1500 1500 1500 1500 $2,000.00 10 Salaries & Wages 6000 6000 6000 5000 11 Telephone 100 100 100 100 Sales Revenue: Regular Special 12 Internet 90 90 90 90 November December January February 13 Electricity 279 360 6334 774 14 Water 230 180 317 387 Marketing & Pie chart for November Yummy Expenses 1000 700 500 500 15 Advertising 16 Insurance 180 180 180 180 17 18 Total Sales 9,300.00 $ 12,000.00 $21,120.00 $ 25,800.00 19 Total Expense 14,029.00 $ 15,710.00 $26,637.00 $ 23,721.00 20 Net Income -4,729.00 $ -3,710.00 $ -5,517.00 $ 2,079.00 22 23 Yummy Net Income . Expenses: . Cost of ingredients Supplies . Shop rental Salaries & Wages . Telephone 24 $3,000.00 . Internet . Electricity . Water 25 $2,000.00 Marketing & Advertising . Insurance 26 $1,000.00 27 28 29 $-1,000,00 30 $-2,000.00 31 5-3,000.00 32 33 $-4,000.00 $-5,000.00 $-6.000.00 Excel formula: (Note: cell value based on my excel) Totals sales = sum(B4 + B5) Total Expenses = sum(B7:B16) Net income = sum(B18-B19) Bar Chart for Yummy Sales $16,000.00 $14,000.00 $12,000.00 $10,000.00 $8,000.00 $6,000.00 $4,000.00 $2,000.00 S- Sales Revenue: Regular Special November December January FebruaryThis bar chart for yummy sales clearly shows that every month sale revenue increasing. Pie chart for November Yummy Expenses I Expenses: I Cost of ingredients I Supplies a Shop rental I Salaries 8: Wages I Telephone I Internet I Electricity I Water I Marketing &Advertising I Insurance This pie chart clearly shows all the expenses (especially cost of ingredients is high). Yummy Net Income $3,000.00 $2,000.00 $1,000.00 5, $4,000.00 $4,000.00 $3,000.00 $4,000.00 $6,000.00 $6,000.00 This line chart clearly shows that net income increasing rapidly. j, the trend of sales, net income in the first four months of operation increasing rapidly and expenses decreased on the month of February ii. Salaries 8: wages is the highest cost of $6000 for November. Internet is the highest cost of $90 for November. iii. Special ice cream type sells more. The bar chart clearly represent that
Step by Step Solution
There are 3 Steps involved in it

Get step-by-step solutions from verified subject matter experts