

Question: each graph shown. Determine whether the graph represents a proportional or non-proportional relationship. Write an equation in the form y = mx or y=mx+b
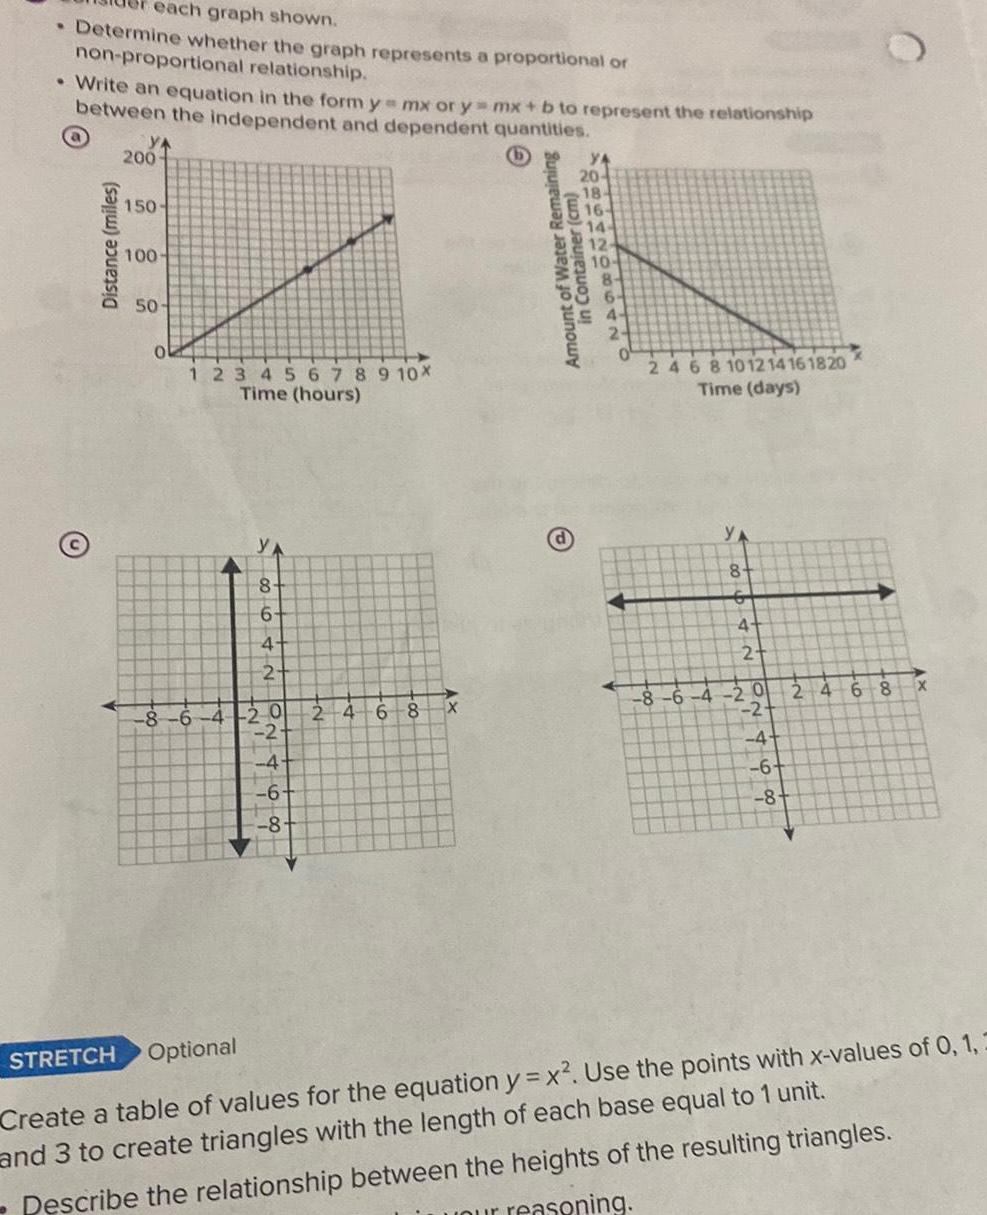
each graph shown. Determine whether the graph represents a proportional or non-proportional relationship. Write an equation in the form y = mx or y=mx+b to represent the relationship between the independent and dependent quantities. Distance (miles) YA 200- 150- 100 50- 1 2 3 4 5 6 7 8 9 10* Time (hours) YA 20- 18- PORCHLOR Amount of Water Remaining in Container (cm) 2- 2 4 6 8 10 12 14 16 18 20 Time (days) 110642 YA 8 y 8- G 4- 2+ 2- -8-6 20 24 6 8 X -8-6-4-20 2 4 68 X -2- -2 -4- -4 -6 -6- -8- -8- STRETCH Optional Create a table of values for the equation y = x. Use the points with x-values of 0, 1, 1 and 3 to create triangles with the length of each base equal to 1 unit. Describe the relationship between the heights of the resulting triangles. reasoning.
Step by Step Solution
There are 3 Steps involved in it

Get step-by-step solutions from verified subject matter experts