

Question: Each histogram in the following questions represents a random sample. We do not know if the variable has a normal distribution in the population, but
Each histogram in the following questions represents a random sample. We do not know if the variable has a normal distribution in the population, but we want to run a t-test to test a claim about the population mean. For each histogram, choose the option that best describes how to proceed with the hypothesis test.
(1)
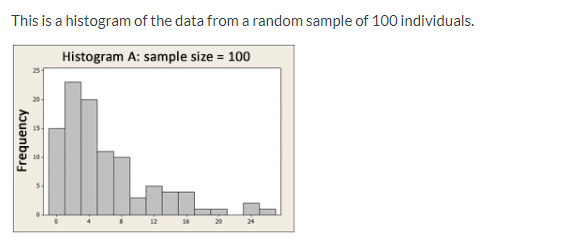
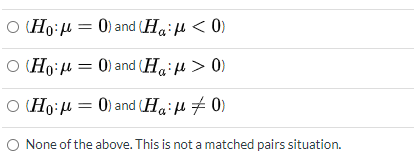
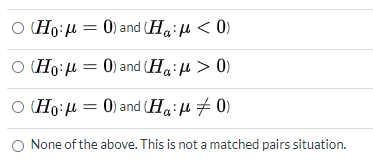
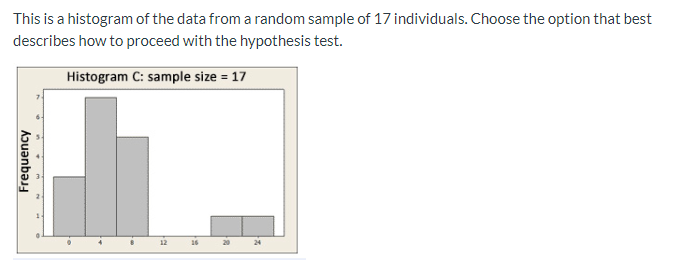
This is a histogram of the data from a random sample of 100 individuals. Histogram A: sample size = 100 23 FrequencyO (Ho:/ = 0) and Ha: M 0) O (Ho: M = 0) and (Hail # 0) O None of the above. This is not a matched pairs situation.O (Ho:/ = 0) and (Ha : p 0) O (Ho:/ = 0) and (Ha: M # 0) None of the above. This is not a matched pairs situation.\f\fThis is a histogram of the data from a random sample of 17 individuals. Choose the option that best describes how to proceed with the hypothesis test. Histogram C: sample size = 17 Frequency w 12 24
Step by Step Solution
There are 3 Steps involved in it

Get step-by-step solutions from verified subject matter experts