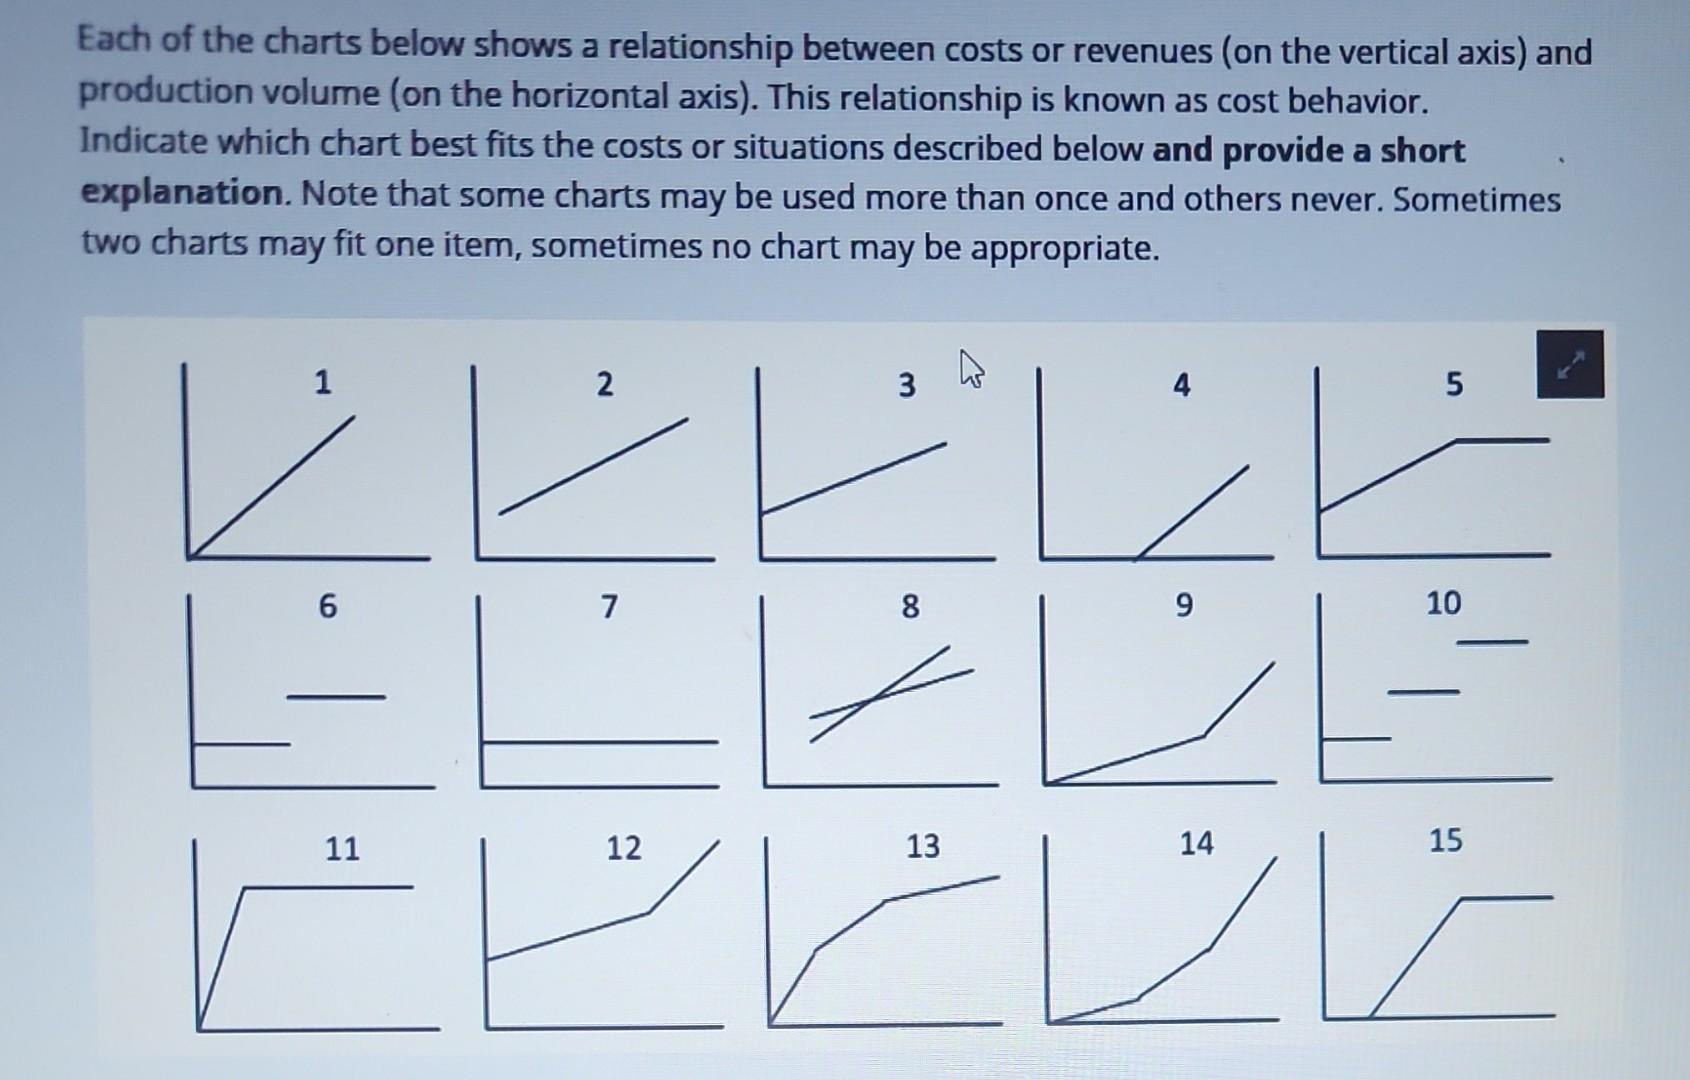
Each of the charts below shows a relationship between costs or revenues (on the vertical axis)...
Fantastic news! We've Found the answer you've been seeking!
Question:
Transcribed Image Text:
Each of the charts below shows a relationship between costs or revenues (on the vertical axis) and production volume (on the horizontal axis). This relationship is known as cost behavior. Indicate which chart best fits the costs or situations described below and provide a short explanation. Note that some charts may be used more than once and others never. Sometimes two charts may fit one item, sometimes no chart may be appropriate. شانا شاشاشا 1 6 7 11 3 12 8 تاتا ترا تاشا شما 9 13 10 14 15 Direct material costs Chart number: Enter your answer here Explanation: Enter your answer here Supervisor's salary Chart number: 14 Explanation: Enter your answer here Electricity costs for a bread packing machine in a bakery Chart number: Enter your answer here Explanation: Enter your answer here I Cost of direct hourly labor with a surcharge of 100% for overtime Chart number: Enter your answer here Explanation: Enter your answer here Cost of raw materials charged at $10 per unit for the first 50 units, $7 per unit for the next 50 units, and $4 per unit for any additional units Chart number: Enter your answer here Explanation: Enter your answer here El Depreciation of plant, calculated on a straight-line basis Chart number: Enter your answer here Explanation: Enter your answer here Electricity costs for a bakery based on a fixed annual charge plus a charge for every kWh (kilowatt hour) used Chart number: Enter your answer here Explanation: Enter your answer here Incentive plan that pays workers an additional $5 for every unit produced above some level of production Chart number: Enter your answer here Explanation: Enter your answer here I Cost of a data transmission service that charges for the first 15,000 minutes of use at a constant rate per minute and is free for any additional minutes of transmission time Chart number: Enter your answer here Explanation: Enter your answer here Each of the charts below shows a relationship between costs or revenues (on the vertical axis) and production volume (on the horizontal axis). This relationship is known as cost behavior. Indicate which chart best fits the costs or situations described below and provide a short explanation. Note that some charts may be used more than once and others never. Sometimes two charts may fit one item, sometimes no chart may be appropriate. شانا شاشاشا 1 6 7 11 3 12 8 تاتا ترا تاشا شما 9 13 10 14 15 Direct material costs Chart number: Enter your answer here Explanation: Enter your answer here Supervisor's salary Chart number: 14 Explanation: Enter your answer here Electricity costs for a bread packing machine in a bakery Chart number: Enter your answer here Explanation: Enter your answer here I Cost of direct hourly labor with a surcharge of 100% for overtime Chart number: Enter your answer here Explanation: Enter your answer here Cost of raw materials charged at $10 per unit for the first 50 units, $7 per unit for the next 50 units, and $4 per unit for any additional units Chart number: Enter your answer here Explanation: Enter your answer here El Depreciation of plant, calculated on a straight-line basis Chart number: Enter your answer here Explanation: Enter your answer here Electricity costs for a bakery based on a fixed annual charge plus a charge for every kWh (kilowatt hour) used Chart number: Enter your answer here Explanation: Enter your answer here Incentive plan that pays workers an additional $5 for every unit produced above some level of production Chart number: Enter your answer here Explanation: Enter your answer here I Cost of a data transmission service that charges for the first 15,000 minutes of use at a constant rate per minute and is free for any additional minutes of transmission time Chart number: Enter your answer here Explanation: Enter your answer here
Expert Answer:
Answer rating: 100% (QA)
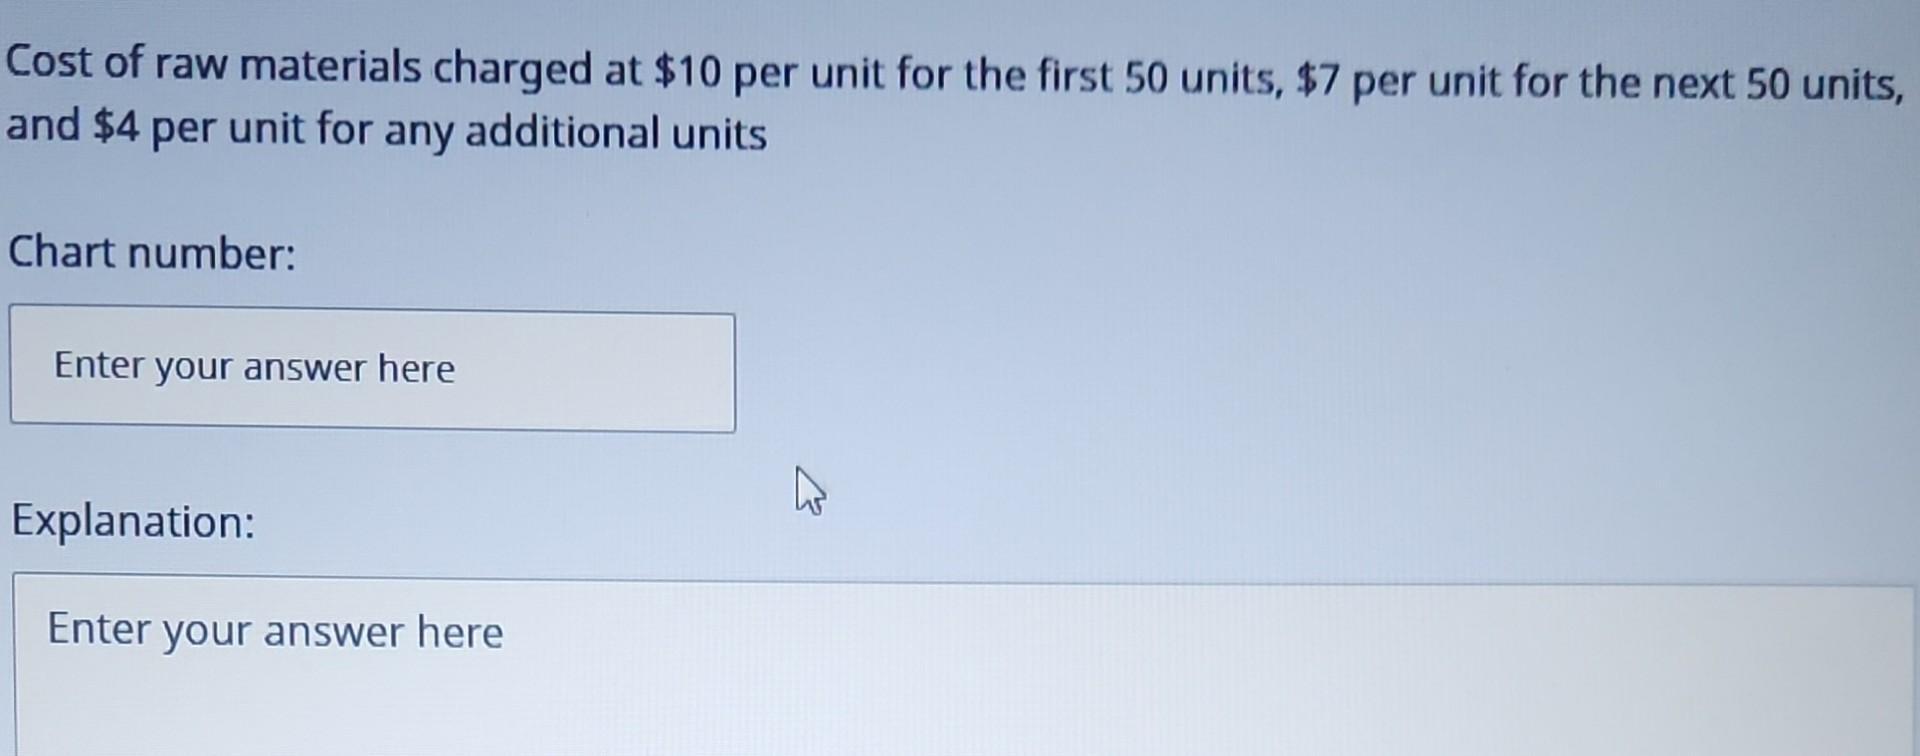
The detailed answer for the above question is provided below Direct material cost Chart Number 1 Direct material cost is a variable costThe cost of materials increases as the level of production incre... View the full answer
Related Book For
Macroeconomics Principles, Applications, and Tools
ISBN: 978-0132555234
7th Edition
Authors: Arthur O Sullivan, Steven M. Sheffrin, Stephen J. Perez
Posted Date:
Students also viewed these accounting questions
-
Match the following. Answers may be used more than once: Measurement Method A. Amortized cost B. Equity method C. Purchase method and consolidation D. Fair value method ___ 1. Less than 20 percent...
-
Match the following. Answers may be used more than once: Measurement Method A. Amortized cost B. Equity method C. Acquisition method and consolidation D. Fair value method Reporting Method 1. Less...
-
Measure the income of Samantha on the vertical axis and the income of Oscar on the horizontal axis, as we did in Figure. Draw several of Sams indifference curves under the following circumstances. a....
-
The following atomic absorption results were obtained for determinations of Zn in multivitamin tablets. All absorbance values are corrected for the appropriate reagent blank (c Zn = 0.0 ng/mL). The...
-
Explain how standard costs and flexible budgets can be used for short-term profit analysis, i.e., for financial control purposes.
-
Using the information in QS 1-18, prepare an income statement and statement of changes in equity for the month ended May 31, 2023, and a balance sheet at May 31, 2023. Data From QS 1-18 Paul Sangha...
-
During the Covid19 pandemic, some people wondered why biologists seemed unable to answer many questions about the virus, including why children rarely became seriously ill, why men were more likely...
-
1. Define YouTube in terms of competitive advantage. 2. Of all Google's competitors, which ones should it attack? Which ones should it avoid? 3. Which basic competitive strategy does Google follow?...
-
12345678 7 9 10 Define Corporate Planning. What is Vision? What is Mission? Give an Example. What is Strategy? Define Environmental Scanning. List out elements of Internal Environment. List out...
-
1. If topaz is harder than quartz, then it will scratch quartz and also feldspar. Topaz is harder than quartz and it is also harder than calcite. Therefore, either topaz will scratch quartz or it...
-
You have $7,000 excess cash to invest after you fully funded your emergency fund. You can choose to use the cash on a T-bill that can be purchased for $6,500 (maturing to value at $10,000 after one...
-
An article in the Economist magazine in 2012 observed: America can now borrow from the bond market at a cheaper rate than at any time in the history of the republic. Use the loanable funds model to...
-
An article in the New York Times in 2012 observed: Older Americans and other savers are just unintended casualties of policies aimed at other economic targets, particularly the policy making it...
-
In 2012, an article in the Economist magazine recommended to investors that if economic growth and inflation remained low in the United States, the investors should buy bonds. But if inflation...
-
You are the senior accountant for a business that regularly imports spare parts for a range of your products from overseas suppliers. You have been instructed by the CEO to look at ways you can save...
-
In which trading centers does 75 percent of all foreign exchange trading take place?
-
You have been asked to audit the financial statements of Rodriguez Company and report on your findings. After examining the beginning and ending inventory counts and calculations for the current...
-
DEPARTMENT DATA EMPLOYEE DATA EmployeeNumber FirstName Mary Rosalie Richard George Alan 3 4 5 7 8 9 855555ES 12 13 14 15 16 17 Create the database tables in SQL or ACCESS: 18 19 20 PROJECT DATA Ken...
-
In June 2008 the consumer price index in Zimbabwe was 8 million percent higher than it was a year before. A $12 lunch in local currency cost 1.1 trillion Zimbabwe dollars. What caused Zimbabwe to...
-
In the last few decades, a progressively smaller share of the top college graduates became teachers. Aptitude is measured by scores on standardized tests, and there is compelling evidence that high...
-
1. No Deadweight Loss from Rent Control? Like other fruit flies, Frudo has an expected life span of 37 days. According to Frudo, if my assumptions are correct, a rent-control law implemented today...
-
How can environmental agents that do not cause gene mutations contribute to cancer?
-
With regard to biological evolution, which of the following statements is incorrect? Explain why. A. During its lifetime, an animal evolves to become better adapted to its environment. B. The process...
-
Marfan syndrome is a rare inherited human disorder characterized by unusually long limbs and digits plus defects in the heart (especially the aorta) and the eyes, among other symptoms. Following is a...
Study smarter with the SolutionInn App