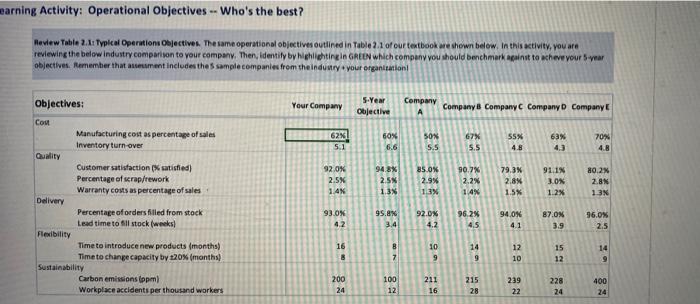
Question: earning Activity: Operational Objectives -- Who's the best? Review Table 2. Typical Operations Objectives. The same operational objectives outlined in Table 2.1 of our textbook

earning Activity: Operational Objectives -- Who's
earning Activity: Operational Objectives -- Who's the best? Review Table 2. Typical Operations Objectives. The same operational objectives outlined in Table 2.1 of our textbook are shown below. In this activity, you are reviewing the below industry comparison to your company. Then, Identity by highlighting in GREIN which company you should benchmark against to where your par objectives. Remember that sement includes the sample companies from the industry your organization Your Company S-Year Objective Company A Company B Company Company Company 62 51 sos SON 5.5 6.6 67% 5.5 55% 4.8 63% 43 70% 4.B 92.0% 2.5% 1.4K 94.8% 2.53 1.3% Objectives: Con Manufacturing cost as percentage of sales Inventory turn over Quality Customer satisfaction ( satisfied) Percentage of scrap/rework Warranty costs as percentage of sales Delivery Percentage of orders filled from stock Lead time to fill stock weeks Flexibility Time to introduce new products (months) Time to change capacity by 120% (months) Sustainability Carbon emissions (open) Workplace accidents per thousand workers 85.0% 2.9% 13% 90.7% 2.2% 1.4% 79.3N 2.8N 1.5% 91 IN 3.OK 1.2 80.2% 2.8% 13 93.0% 95.8 3.4 92.0% 4.2 96.2% 4.5 94.0N 4.1 87.ON 3.9 96.0 2.5 16 B 7 10 9 14 9 12 10 15 12 14 9 200 24 100 12 211 16 215 28 239 22 228 24 400 24 earning Activity: Operational Objectives -- Who's the best? Review Table 2. Typical Operations Objectives. The same operational objectives outlined in Table 2.1 of our textbook are shown below. In this activity, you are reviewing the below industry comparison to your company. Then, Identity by highlighting in GREIN which company you should benchmark against to where your par objectives. Remember that sement includes the sample companies from the industry your organization Your Company S-Year Objective Company A Company B Company Company Company 62 51 sos SON 5.5 6.6 67% 5.5 55% 4.8 63% 43 70% 4.B 92.0% 2.5% 1.4K 94.8% 2.53 1.3% Objectives: Con Manufacturing cost as percentage of sales Inventory turn over Quality Customer satisfaction ( satisfied) Percentage of scrap/rework Warranty costs as percentage of sales Delivery Percentage of orders filled from stock Lead time to fill stock weeks Flexibility Time to introduce new products (months) Time to change capacity by 120% (months) Sustainability Carbon emissions (open) Workplace accidents per thousand workers 85.0% 2.9% 13% 90.7% 2.2% 1.4% 79.3N 2.8N 1.5% 91 IN 3.OK 1.2 80.2% 2.8% 13 93.0% 95.8 3.4 92.0% 4.2 96.2% 4.5 94.0N 4.1 87.ON 3.9 96.0 2.5 16 B 7 10 9 14 9 12 10 15 12 14 9 200 24 100 12 211 16 215 28 239 22 228 24 400 24

Step by Step Solution

There are 3 Steps involved in it

1 Expert Approved Answer
Step: 1 Unlock blur-text-image
Question Has Been Solved by an Expert!

Get step-by-step solutions from verified subject matter experts

Step: 2 Unlock
Step: 3 Unlock

Students Have Also Explored These Related General Management Questions!