

Question: EBIT-EPS and capital structure Data-Chock is considering two capital structures. The koy information is shown in the following table. Assume a 40% tax fate. a.
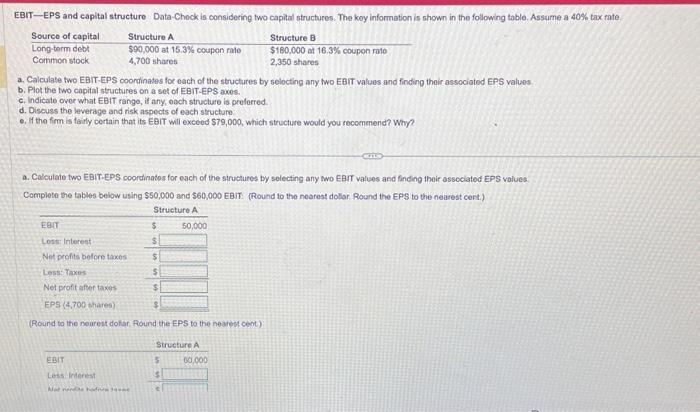
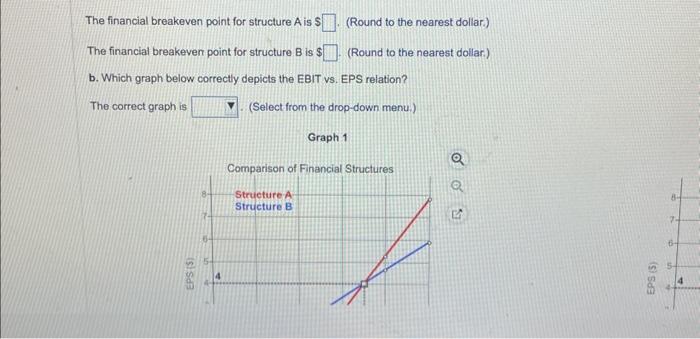
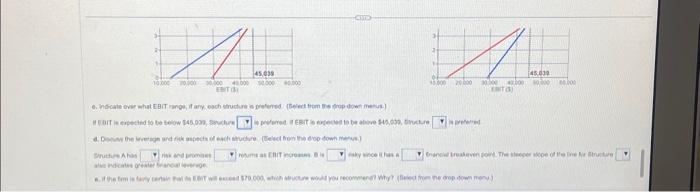
EBIT-EPS and capital structure Data-Chock is considering two capital structures. The koy information is shown in the following table. Assume a 40% tax fate. a. Calculate two EBIT-EPS coondinates for each of the structures by selocting ary two EerT values and finding their associated EPS values. b. Plot the two capital structures on a set of EBIT-EPS axos. c. Indicate ovor what EBIT range, if any, oach structuro is proferred d. Discuss the leverage and risk aspects of each structure: e. It the firm is foirly certain that its E8IT will exceed $79,000, which structure would you recoenmend? Why? a. Calculate two EBIT-EPS coordinatos for each of the structures by solecting any wo EBIT valisos and finding their osscciated EPS values: Complete the tables below using $50,000 and $60,000 EBI: (Round to the neareat dollar Round the EPS to the nearest cert) (Rourd to the nearest dolar. Flound the EPS to the noarest cent): The financial breakeven point for structure A is S (Round to the nearest dollar.) The financial breakeven point for structure B is $ (Round to the nearest dollar.) b. Which graph below correctly depicts the EBIT vs. EPS relation? The correct graph is (Select from the drop-down menu.) Graph 1
Step by Step Solution
There are 3 Steps involved in it

Get step-by-step solutions from verified subject matter experts