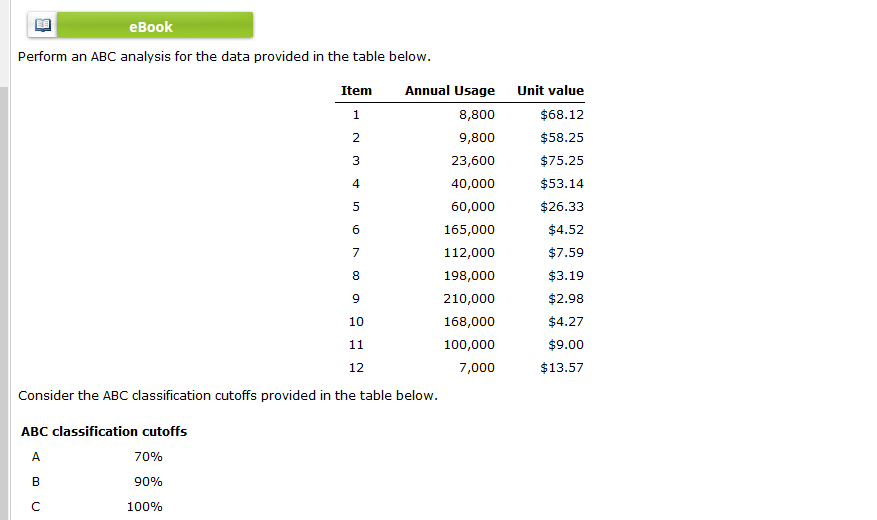
Question: eBook Perform an ABC analysis for the data provided in the table below. Item Annual Usage 8,800 9,800 23,600 40,000 60,000 165,000 112,000 198,000 210,000

eBook Perform an ABC analysis for the dataeBook Perform an ABC analysis for the data

eBook Perform an ABC analysis for the data provided in the table below. Item Annual Usage 8,800 9,800 23,600 40,000 60,000 165,000 112,000 198,000 210,000 168,000 100,000 7,000 Unit value $68.12 $58.25 $75.25 $53.14 $26.33 $4.52 $7.59 $3.19 $2.98 $4.27 $9.00 $13.57 Consider the ABC classification cutoffs provided in the table below. ABC classification cutoffs 70% 90% 100% Complete the table below. Do not round intermediate calculations. Round your answers to two decimal places. Projected Cumulative Cumulative Cumulative Dollar Usage Dollar Percent Percent Item Annual Usage of Total of Items -Select- ABC Classification -Select- -Select- to -Select- to -Select- to -Select- to to -Select- -Select- -Select- to -Select- -Select- -Select- -Select- -Select- -Select- AAAAAAAAAAAA to to -Select- -Select- -Select- to -Select- to -Select- -Select- to -Select- -Select- to -Select

Step by Step Solution

There are 3 Steps involved in it

1 Expert Approved Answer
Step: 1 Unlock blur-text-image
Question Has Been Solved by an Expert!

Get step-by-step solutions from verified subject matter experts

Step: 2 Unlock
Step: 3 Unlock

Students Have Also Explored These Related General Management Questions!