

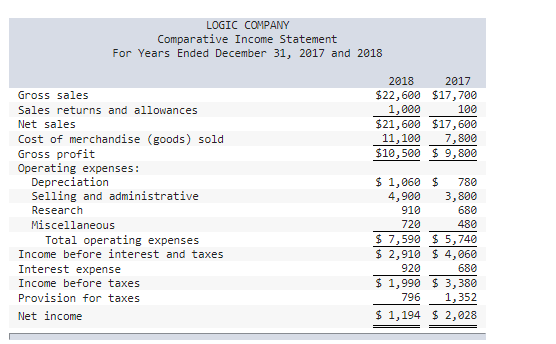
Question: eBookPrintReferencesCheck my workCheck My Work button is now enabled3Item 8 LOGIC COMPANY Comparative Income Statement For Years Ended December 31, 2017 and 2018 2018 2017
eBookPrintReferencesCheck my workCheck My Work button is now enabled3Item 8 LOGIC COMPANY Comparative Income Statement For Years Ended December 31, 2017 and 2018 2018 2017 Gross sales $ 22,600 $ 17,700 Sales returns and allowances 1,000 100 Net sales $ 21,600 $ 17,600 Cost of merchandise (goods) sold 11,100 7,800 Gross profit $ 10,500 $ 9,800 Operating expenses: Depreciation $ 1,060 $ 780 Selling and administrative 4,900 3,800 Research 910 680 Miscellaneous 720 480 Total operating expenses $ 7,590 $ 5,740 Income before interest and taxes $ 2,910 $ 4,060 Interest expense 920 680 Income before taxes $ 1,990 $ 3,380 Provision for taxes 796 1,352 Net income $ 1,194 $ 2,028 LOGIC COMPANY Comparative Balance Sheet December 31, 2017 and 2018 2018 2017 Assets Current assets: Cash $ 11,700 $ 8,900 Accounts receivable 16,200 12,200 Merchandise inventory 8,200 13,700 Prepaid expenses 23,700 9,700 Total current assets $ 59,800 $ 44,500 Plant and equipment: Building (net) $ 14,200 $ 10,700 Land 13,200 8,700 Total plant and equipment $ 27,400 $ 19,400 Total assets $ 87,200 $ 63,900 Liabilities Current liabilities: Accounts payable $ 12,700 $ 7,000 Salaries payable 6,800 4,700 Total current liabilities $ 19,500 $ 11,700 Long-term liabilities: Mortgage note payable 21,700 20,200 Total liabilities $ 41,200 $ 31,900 Stockholders Equity Common stock $ 20,700 $ 20,800 Retained earnings 25,300 11,200 Total stockholders equity $ 46,000 $ 32,000 Total liabilities and stockholders equity $ 87,200 $ 63,900 Calculate the acid test ratio. (Round your answers to the nearest hundredth.)
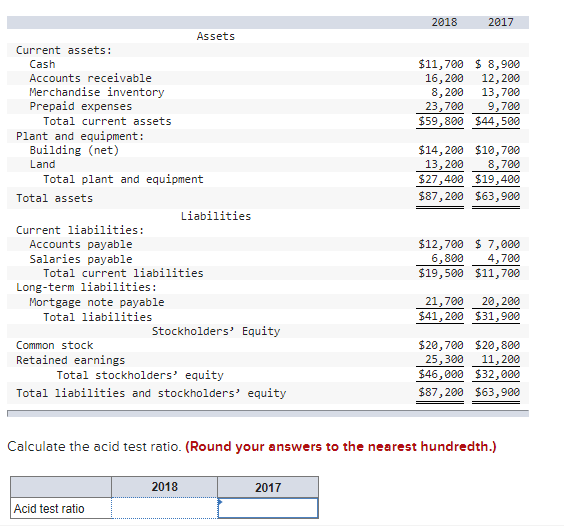
Calculate the acid test ratio. (Round your answers to the nearest hundredth.)
Step by Step Solution
There are 3 Steps involved in it

Get step-by-step solutions from verified subject matter experts