

Question: The results shown below are mean productivity measurements (average number of assemblies completed per hour) for a random sample of workers at each of
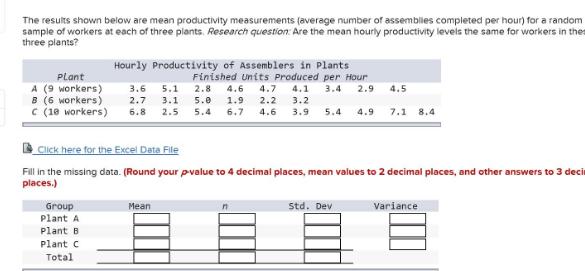
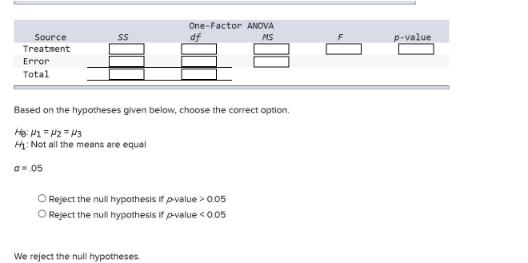
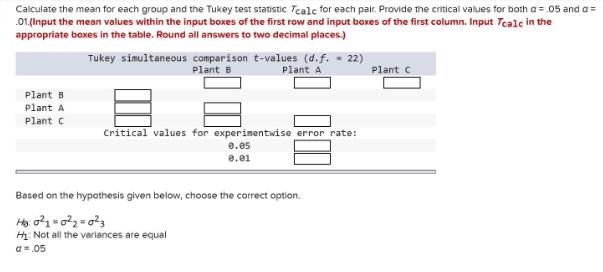
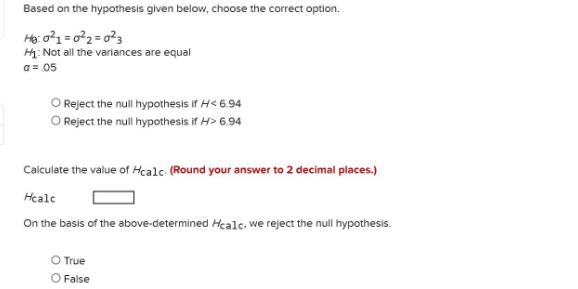
The results shown below are mean productivity measurements (average number of assemblies completed per hour) for a random sample of workers at each of three plants. Research question: Are the mean hourly productivity levels the same for workers in thes three plants? Hourly Productivity of Assemblers in Plants Finished units Produced per Hour 3.4 Plant A (9 workers) B (6 workers) C (1e workers) 3.6 5.1 2.8 4.6 4.7 4.1 2.9 4.5 2.7 3.1 5.0 1.9 2.2 3.2 6.8 2.5 5.4 6.7 4.6 3.9 5.4 4.9 7.1 8.4 Click here for the Excel Data File Fill in the missing data. (Round your pvalue to 4 decimal places, mean values to 2 decimal places, and other answers to 3 deci places.) Mean Std. Dev Variance Group Plant A Plant B Plant C Total One-Factor ANOVA Source SS df MS p-value Treatment Error Total Based on the hypotheses given below, choose the correct option. Hg: P1 = P2 = 3 H: Not all the means are equal a= 05 O Reject the null hypothesis if pvalue > 0.05 O Reject the null hypothesis if pvalue < 0.05 We reject the null hypotheses. Calculate the mean for each group and the Tukey test statistic Tcale for each pair. Provide the critical values for both a =.05 and a= .01.(Input the mean values within the input boxes of the first row and input boxes of the first column. Input Tcale in the appropriate boxes in the table. Round all answers to two decimal places.) Tukey simultaneous comparison t-values (d.f. - 22) Plant 8 Plant A Plant C Plant B Plant A Plant c Critical values for experimentwise error rate: 0.es e.e1 Based on the hypothesis given below, choose the correct option. Hi Not all the variances are equal a= .05 Based on the hypothesis given below, choose the correct option. H: Not all the variances are equal a = 05 Reject the null hypothesis if H < 6.94 O Reject the null hypothesis if H> 6.94 Calculate the value of Hcalc (Round your answer to 2 decimal places.) Heale On the basis of the above-determined Hcalc. we reject the null hypothesis. O True False
Step by Step Solution
3.32 Rating (158 Votes )
There are 3 Steps involved in it
To address this question we need to perform several statistical calculations and fill in the missing pieces based on the given data Lets tackle it ste... View full answer

Get step-by-step solutions from verified subject matter experts