

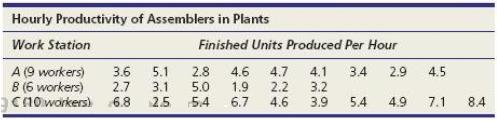
The results shown below are mean productivity measurements (average number of assemblies completed per hour) for a
Question:
(a) At α = .05, is there a difference in median productivity? Use MegaStat, MINITAB, or a similar computer package for the calculations.
(b) Use one-factor ANOVA to compare the means. Do you reach the same conclusion?
(c) Make a histogram or other display of the pooled data. Does the assumption of normality seem justified?
Fantastic news! We've Found the answer you've been seeking!
Step by Step Answer:
a At 05 there is a difference in median productivity because the p value is less than 05 KruskalWall...View the full answer

Answered By
Utsab mitra
I have the expertise to deliver these subjects to college and higher-level students. The services would involve only solving assignments, homework help, and others.
I have experience in delivering these subjects for the last 6 years on a freelancing basis in different companies around the globe. I am CMA certified and CGMA UK. I have professional experience of 18 years in the industry involved in the manufacturing company and IT implementation experience of over 12 years.
I have delivered this help to students effortlessly, which is essential to give the students a good grade in their studies.
2+ Reviews
10+ Question Solved
Related Book For 

Applied Statistics In Business And Economics
ISBN: 9780073521480
4th Edition
Authors: David Doane, Lori Seward
Question Posted:
