

b. Re-design the spreadsheet model to incorporate the random variability of the annual salary growth rate and
Fantastic news! We've Found the answer you've been seeking!
Question:
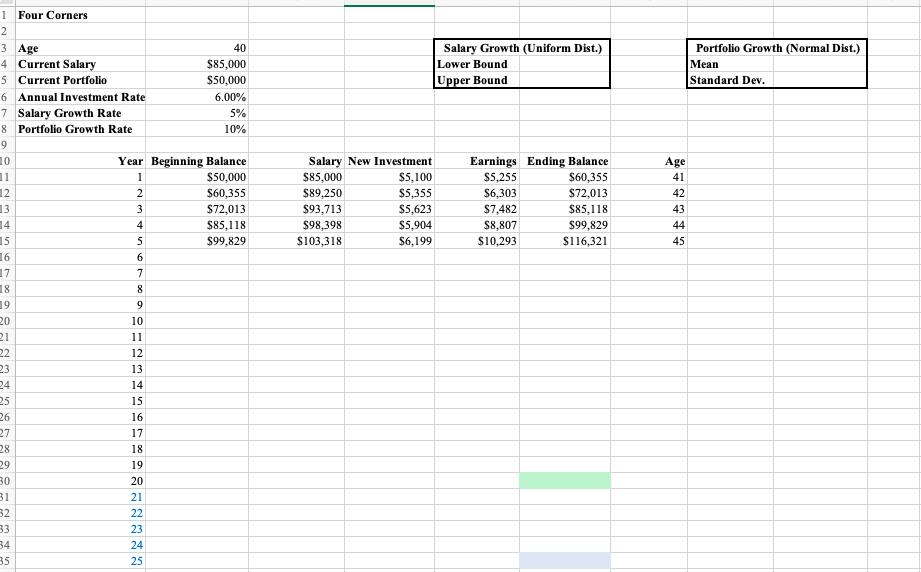
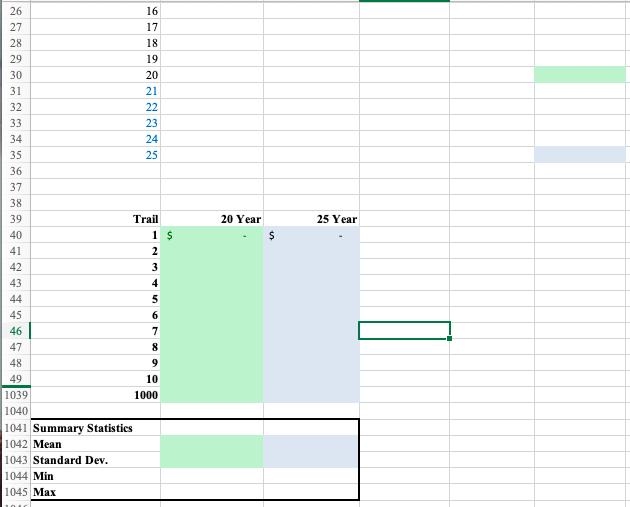
b. Re-design the spreadsheet model to incorporate the random variability of the annual salary growth rate and the annual portfolio growth rate into a simulation model. Assume that Tom is willing to use the annual investment rate that predicted a 20-year $1,000,000 portfolio from your answer to part a above. Run the simulation model 1000 times and determine the mean and standard deviation of the 20-year result.
Answer From Part A)
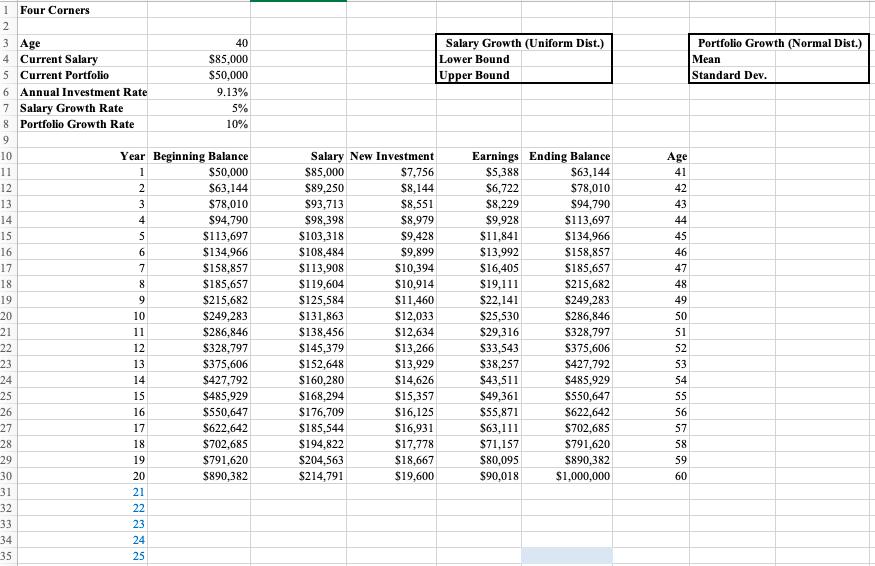
- Without considering random variability, extend the current worksheet to 20 years (Hint: To extend current worksheet to 20 years: Select A15 to G15 Drag the selection down to row 30 by clicking on the lower right corner of the selection and dragging down). Confirm that by using the constant annual salary growth rate and the constant annual portfolio growth rate Tom can expect to have a 20-year portfolio of $772,722. What would Tom’s annual investment rate have to be in order for his portfolio to reach a 20-year goal of $1,000,000? (Hint: use Excel’s Goal Seek; How to use Goal Seek: Data ► What-If Analysis, select Goal Seek, select F30 for Set Cell, enter the goal of 1000000 into To Value, and select B6 for By Changing Cell)
Tom’s annual investment rate would have to be 9.13% in order for his portfolio to reach a 20-year goal of $1,000,000.
Expert Answer:
Hai we can answer only one question through one doubt uploaded The procedure in Analytic Solver P... View the full answer

Related Book For 

Macroeconomics
ISBN: 978-1319120054
3rd Canadian edition
Authors: Paul Krugman, Robin Wells , Iris Au , Jack Parkinson
Posted Date:
