

Question: Table B. 25 contains the golf data on strokes gained. Use all possible regressions to build a model for these data. Perform a residual analysis
Table B. 25 contains the golf data on strokes gained. Use all possible regressions to build a model for these data. Perform a residual analysis on the final model and comment on model adequacy.
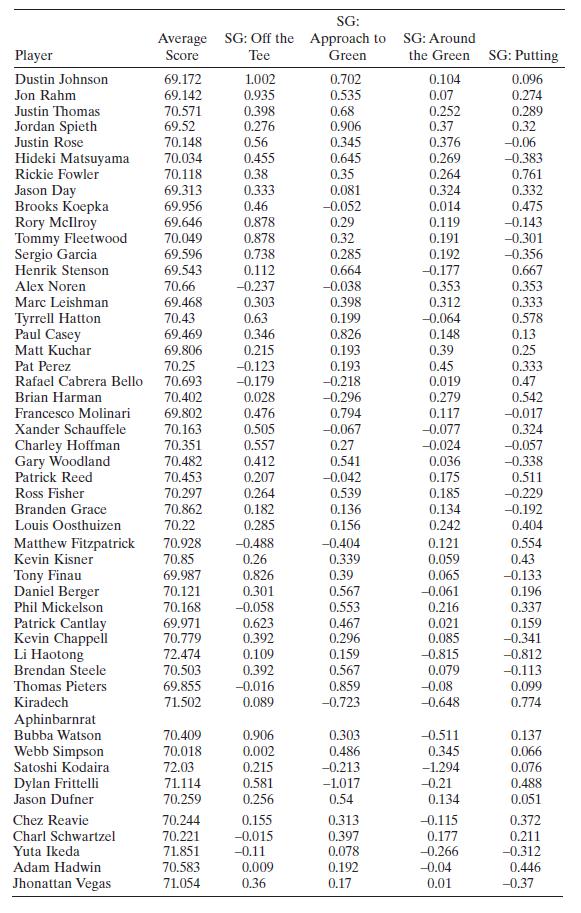
SG: Average SG: Off the Approach to SG: Around Player Score Tee Green the Green SG: Putting Dustin Johnson 69.172 1.002 0.702 0.104 0.096 Jon Rahm 69.142 0.935 0.535 0.07 0.274 Justin Thomas 70.571 0.398 0.68 0.252 0.289 Jordan Spieth 69.52 0.276 0.906 0.37 0.32 Justin Rose 70.148 0.56 0.345 0.376 -0.06 Hideki Matsuyama 70.034 0.455 0.645 0.269 -0.383 Rickie Fowler 70.118 0.38 0.35 0.264 0.761 Jason Day 69.313 0.333 0.081 0.324 0.332 Brooks Koepka 69.956 0.46 -0.052 0.014 0.475 Rory McIlroy 69.646 0.878 0.29 0.119 -0.143 Tommy Fleetwood 70.049 0.878 0.32 0.191 -0.301 Sergio Garcia 69.596 0.738 0.285 0.192 -0.356 Henrik Stenson 69.543 0.112 0.664 -0.177 0.667 Alex Noren 70.66 -0.237 -0.038 0.353 0.353 Marc Leishman 69.468 0.303 0.398 0.312 0.333 Tyrrell Hatton 70.43 0.63 0.199 -0.064 0.578 Paul Casey 69.469 0.346 0.826 0.148 0.13 Matt Kuchar 69.806 0.215 0.193 0.39 0.25 Pat Perez 70.25 -0.123 0.193 0.45 0.333 Rafael Cabrera Bello 70.693 -0.179 -0.218 0.019 0.47 Brian Harman 70.402 0.028 -0.296 0.279 0.542 Francesco Molinari 69.802 0.476 0.794 0.117 -0.017 Xander Schauffele 70.163 0.505 -0.067 -0.077 0.324 Charley Hoffman 70.351 0.557 0.27 -0.024 -0.057 Gary Woodland 70.482 0.412 0.541 0.036 -0.338 Patrick Reed 70.453 0.207 -0.042 0.175 0.511 Ross Fisher 70.297 0.264 0.539 0.185 -0.229 Branden Grace 70.862 0.182 0.136 0.134 -0.192 Louis Oosthuizen 70.22 0.285 0.156 0.242 0.404 Matthew Fitzpatrick 70.928 -0.488 -0.404 0.121 0.554 Kevin Kisner 70.85 0.26 0.339 0.059 0.43 Tony Finau 69.987 0.826 0.39 0.065 -0.133 Daniel Berger 70.121 0.301 0.567 -0.061 0.196 Phil Mickelson 70.168 -0.058 0.553 0.216 0.337 Patrick Cantlay 69.971 0.623 0.467 0.021 0.159 Kevin Chappell 70.779 0.392 0.296 0.085 -0.341 Li Haotong 72.474 0.109 0.159 -0.815 -0.812 Brendan Steele 70.503 0.392 0.567 0.079 -0.113 Thomas Pieters 69.855 -0.016 0.859 -0.08 0.099 Kiradech 71.502 0.089 -0.723 -0.648 0.774 Aphinbarnrat Bubba Watson 70.409 0.906 0.303 -0.511 0.137 Webb Simpson 70.018 0.002 0.486 0.345 0.066 Satoshi Kodaira 72.03 0.215 -0.213 -1.294 0.076 Dylan Frittelli 71.114 0.581 -1.017 -0.21 0.488 Jason Dufner 70.259 0.256 0.54 0.134 0.051 Chez Reavie 70.244 0.155 0.313 -0.115 0.372 Charl Schwartzel 70.221 -0.015 0.397 0.177 0.211 Yuta Ikeda 71.851 -0.11 0.078 -0.266 -0.312 Adam Hadwin 70.583 0.009 0.192 -0.04 0.446 Jhonattan Vegas 71.054 0.36 0.17 0.01 -0.37
Step by Step Solution
There are 3 Steps involved in it

Get step-by-step solutions from verified subject matter experts