

Question: Educators compare students' satisfaction level using large samples from two groups. Group I included n = 400 undergraduate students. Group II was formed by
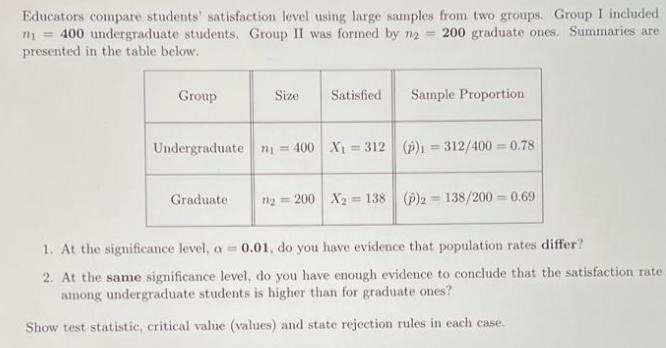
Educators compare students' satisfaction level using large samples from two groups. Group I included n = 400 undergraduate students. Group II was formed by n2 presented in the table below. = 200 graduate ones. Sumnmaries are Group Size Satisfied Sample Proportion Undergraduate ni = 400 X = 312 (p)1 = 312/400 0.78 %3D %3D Graduate n2 = 200 X2 = 138 (p)2 = 138/200 = 0.69 1. At the significance level, a = 0.01, do you have evidence that population rates differ? 2. At the same significance level, do you have enough evidence to conclude that the satisfaction rate among undergraduate students is higher than for graduate ones? Show test statistic, critical value (values) and state rejection rules in each case.
Step by Step Solution
3.38 Rating (151 Votes )
There are 3 Steps involved in it
For sample 1 we have that the sample size is N1400 the number of favourable cases is X1312 so then t... View full answer

Get step-by-step solutions from verified subject matter experts