

Question: efer to Cable 561 - Factors for Comouting Control Chart Limits (3 siamat for this problem. process that is considered to be in control measures
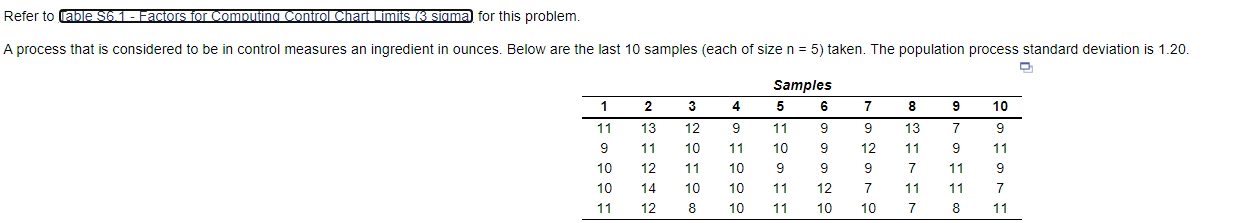
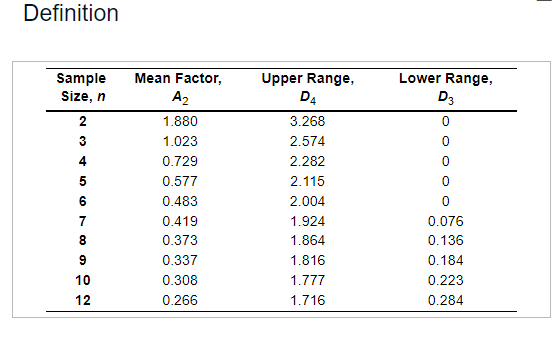
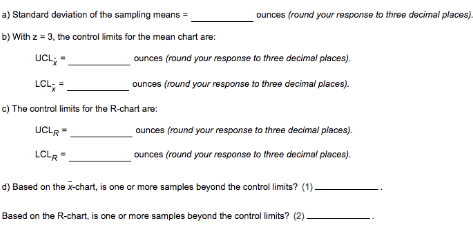
efer to Cable 561 - Factors for Comouting Control Chart Limits (3 siamat for this problem. process that is considered to be in control measures an ingredient in ounces. Below are the last 10 samples (each of size n=5 ) taken. The population process standard deviation is 1.20 . Definition a) Standard deviation of the sampling means = ounces (round your response to three decimal places) b) With z=3, the control limits for the mean chart are: UCLx=LCLx= ounces (round your response to three decimal places). ounces (round your response to three decimal places). c) The control limits for the R-chart are: UCLR=LCLR= ounces (round your response to three decimal places). ounces (round your response to three decimal places). d) Based on the x-chart, is one or more samples beyond the control limits? (1) . Based on the R-chart, is one or more samples beyond the control limits? (2) efer to Cable 561 - Factors for Comouting Control Chart Limits (3 siamat for this problem. process that is considered to be in control measures an ingredient in ounces. Below are the last 10 samples (each of size n=5 ) taken. The population process standard deviation is 1.20 . Definition a) Standard deviation of the sampling means = ounces (round your response to three decimal places) b) With z=3, the control limits for the mean chart are: UCLx=LCLx= ounces (round your response to three decimal places). ounces (round your response to three decimal places). c) The control limits for the R-chart are: UCLR=LCLR= ounces (round your response to three decimal places). ounces (round your response to three decimal places). d) Based on the x-chart, is one or more samples beyond the control limits? (1) . Based on the R-chart, is one or more samples beyond the control limits? (2)
Step by Step Solution
There are 3 Steps involved in it

Get step-by-step solutions from verified subject matter experts