

Question: efer to Table S6.1 - Factors for Computing Control Chart Limits (3 sigma) for this problem. process that is considered to be in control measures
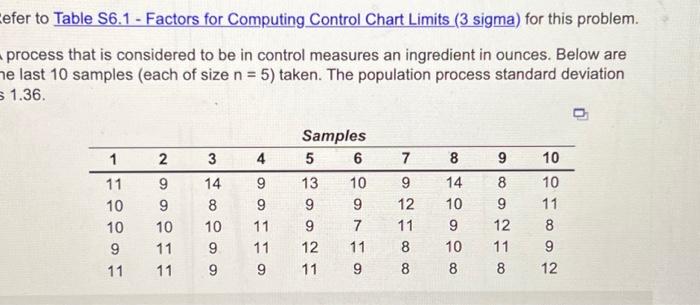
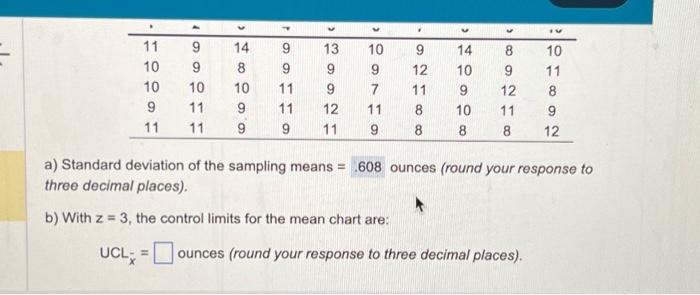
efer to Table S6.1 - Factors for Computing Control Chart Limits (3 sigma) for this problem. process that is considered to be in control measures an ingredient in ounces. Below are e last 10 samples (each of size n=5 ) taken. The population process standard deviation 1.36 . a) Standard deviation of the sampling means = ounces (round your response to three decimal places). b) With z=3, the control limits for the mean chart are: UCLx= ounces (round your response to three decimal places)
Step by Step Solution
There are 3 Steps involved in it
1 Expert Approved Answer
Step: 1 Unlock

Question Has Been Solved by an Expert!
Get step-by-step solutions from verified subject matter experts
Step: 2 Unlock
Step: 3 Unlock