

Question: egement - Personal - Microsoft Edge t / PlayerHomework . aspx?homeworkld = 6 6 9 2 1 4 6 0 5 &questionld = 1 &flushed
egement Personal Microsoft Edge
tPlayerHomeworkaspx?homeworkld&questionld&flushedfalse&clderwiny A
Darius Ray : PM
Question Problem
HW Score: of
points
Part of
Points: of
Save
table
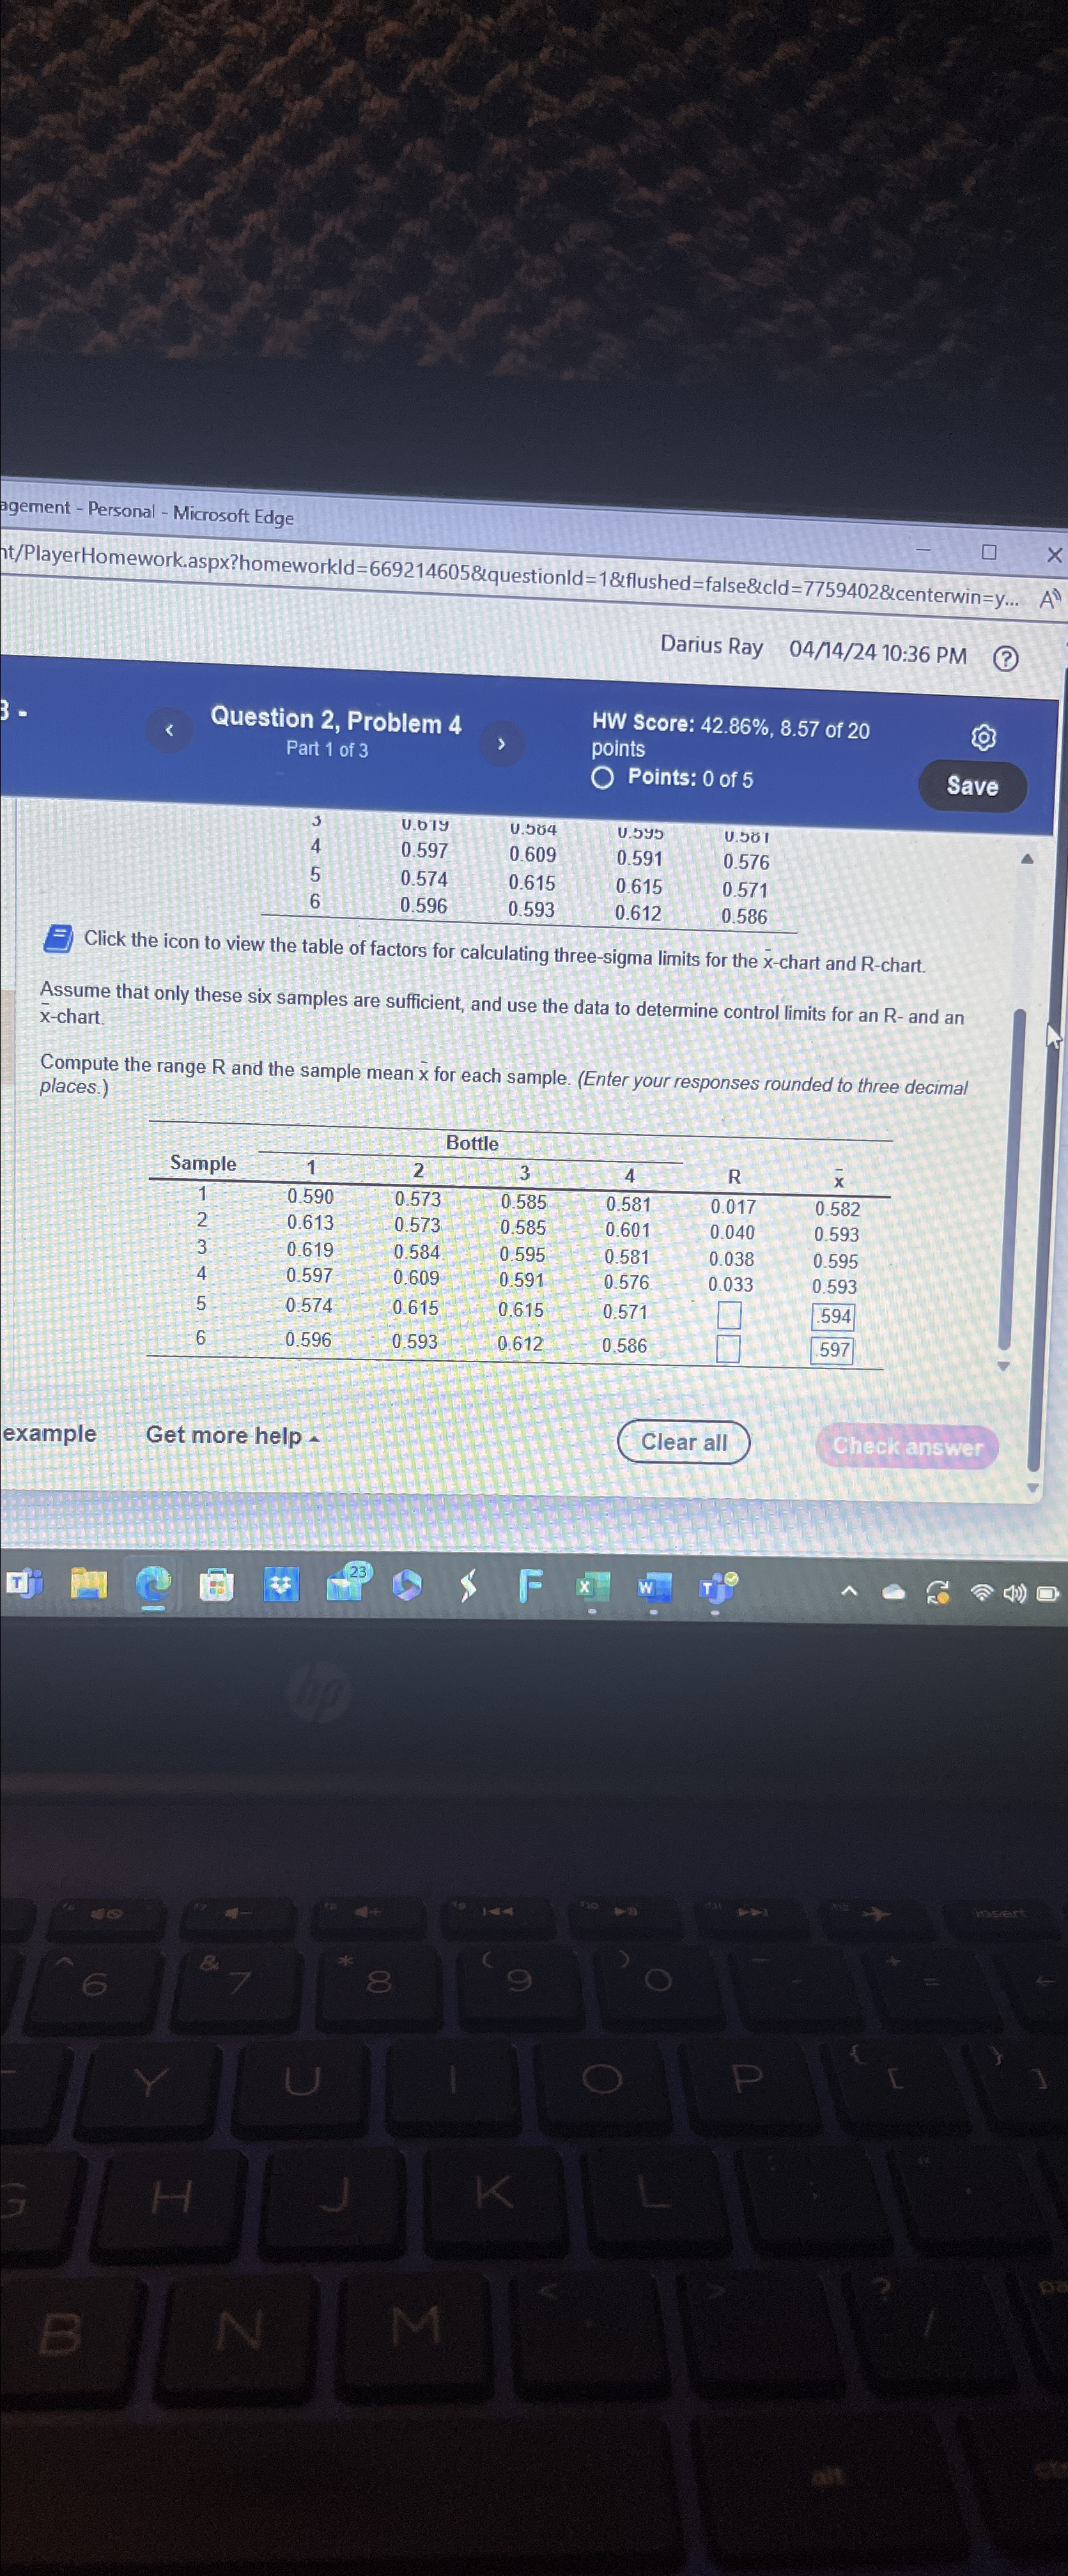
Click the icon to view the table of factors for calculating threesigma limits for the chart and Rchart.
Assume that only these six samples are sufficient, and use the data to determine control limits for an R and an xchart.
Compute the range and the sample mean for each sample. Enter your responses rounded to three decima places.
tableBottleSampleR
Step by Step Solution
There are 3 Steps involved in it
1 Expert Approved Answer
Step: 1 Unlock

Question Has Been Solved by an Expert!
Get step-by-step solutions from verified subject matter experts
Step: 2 Unlock
Step: 3 Unlock