

Question: EGN 4 4 5 3 Lab 2 The background for this assignment is that you are provided the experimental data from a single experiment, but
EGN Lab
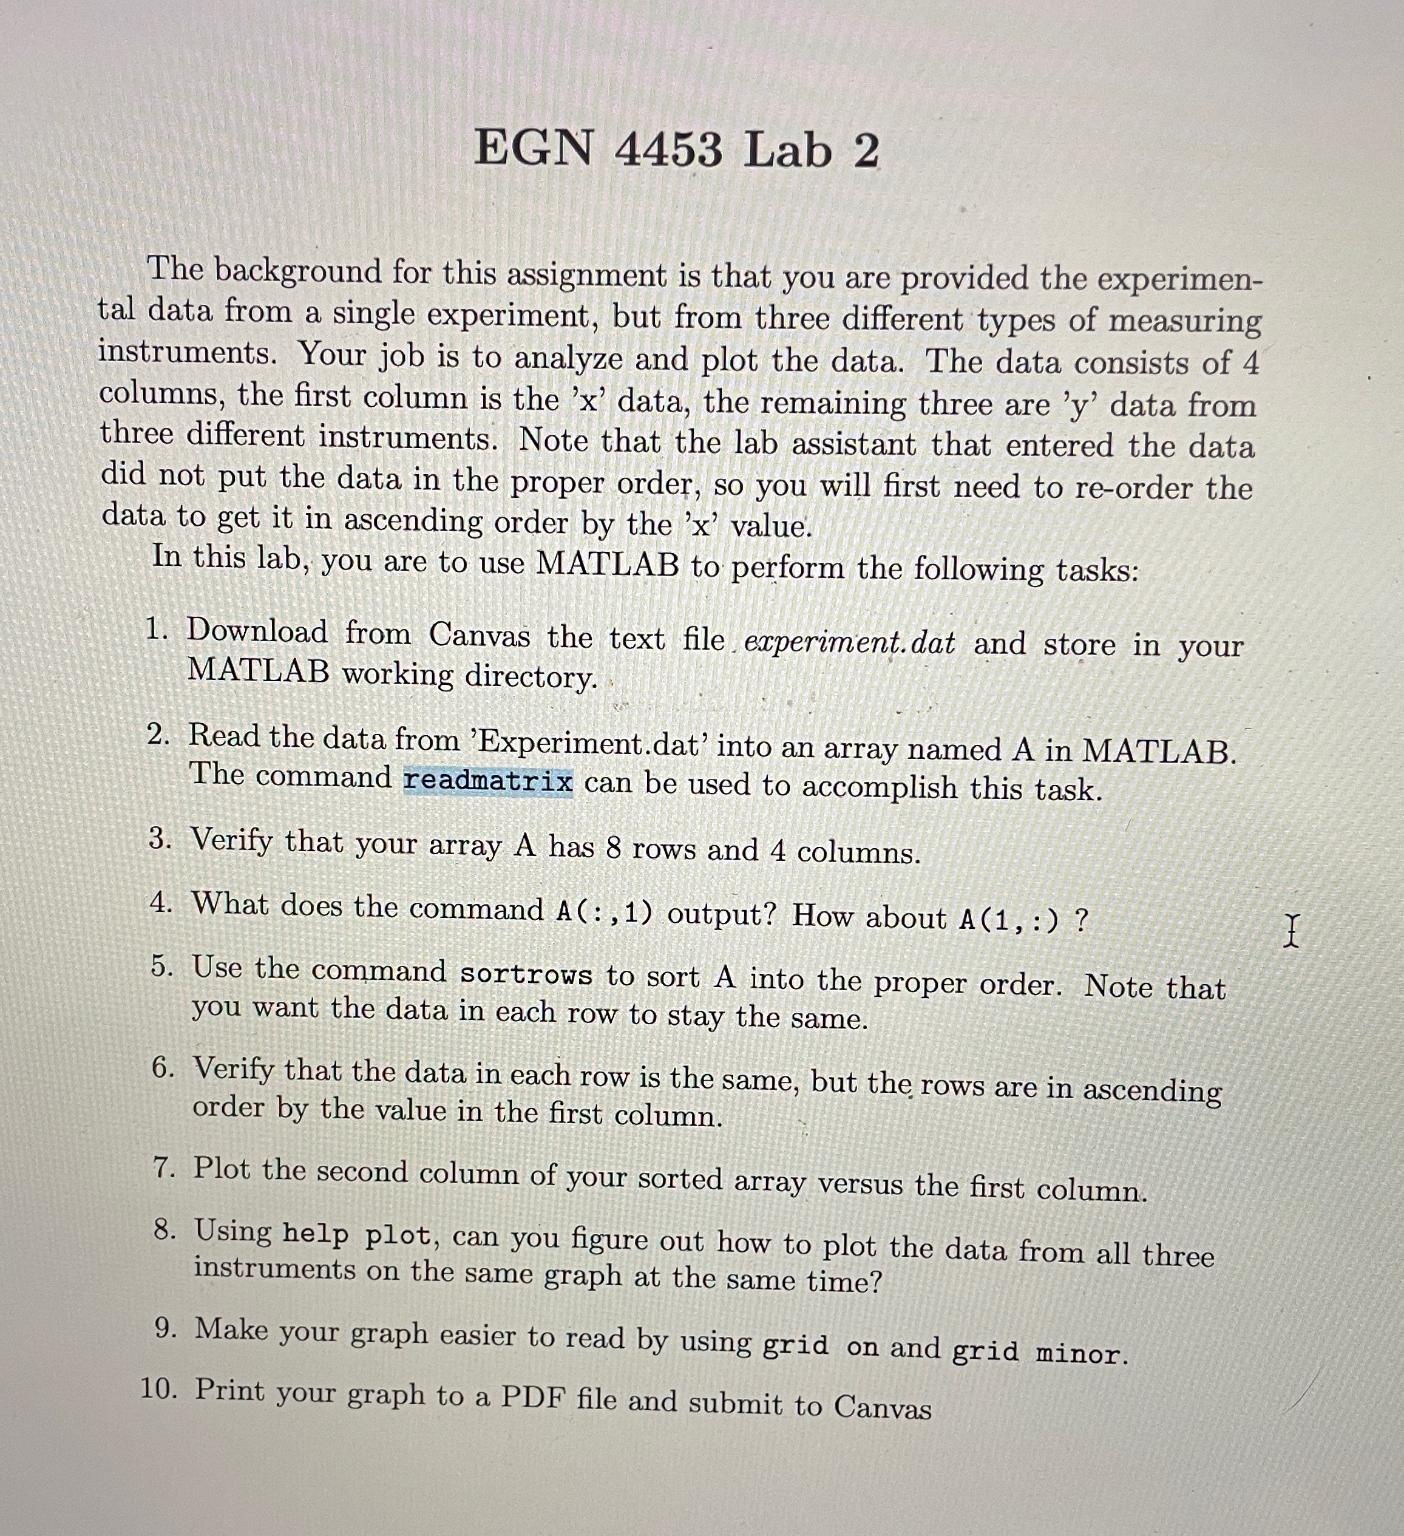
The background for this assignment is that you are provided the experimental data from a single experiment, but from three different types of measuring instruments. Your job is to analyze and plot the data. The data consists of columns, the first column is the data, the remaining three are data from three different instruments. Note that the lab assistant that entered the data did not put the data in the proper order, so you will first need to reorder the data to get it in ascending order by the value.
In this lab, you are to use MATLAB to perform the following tasks:
Download from Canvas the text file experiment.dat and store in your MATLAB working directory.
Read the data from 'Experiment.dat' into an array named A in MATLAB. The command readmatrix can be used to accomplish this task.
Verify that your array A has rows and columns.
What does the command A : output? How about :
Use the command sortrows to sort A into the proper order. Note that you want the data in each row to stay the same.
Verify that the data in each row is the same, but the rows are in ascending order by the value in the first column.
Plot the second column of your sorted array versus the first column.
Using help plot, can you figure out how to plot the data from all three instruments on the same graph at the same time?
Make your graph easier to read by using grid on and grid minor.
Print your graph to a PDF file and submit to Canvas
Step by Step Solution
There are 3 Steps involved in it
1 Expert Approved Answer
Step: 1 Unlock

Question Has Been Solved by an Expert!
Get step-by-step solutions from verified subject matter experts
Step: 2 Unlock
Step: 3 Unlock