

Question: Eigenvalues and eigenvectors are important in Civil Engineering. All structures, from buildings to bridges, have natural frequencies of vibration. If external forces, like wind or
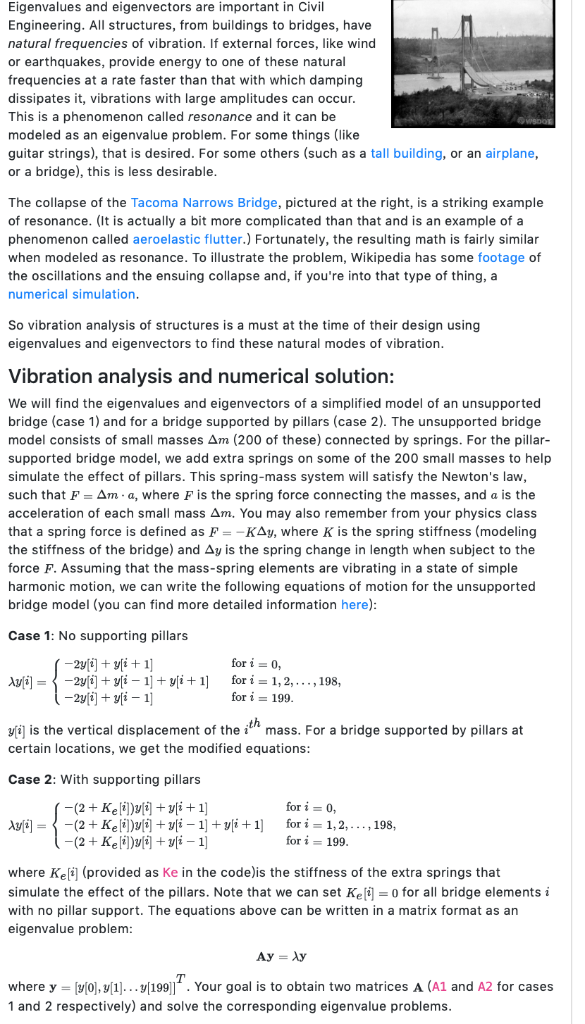
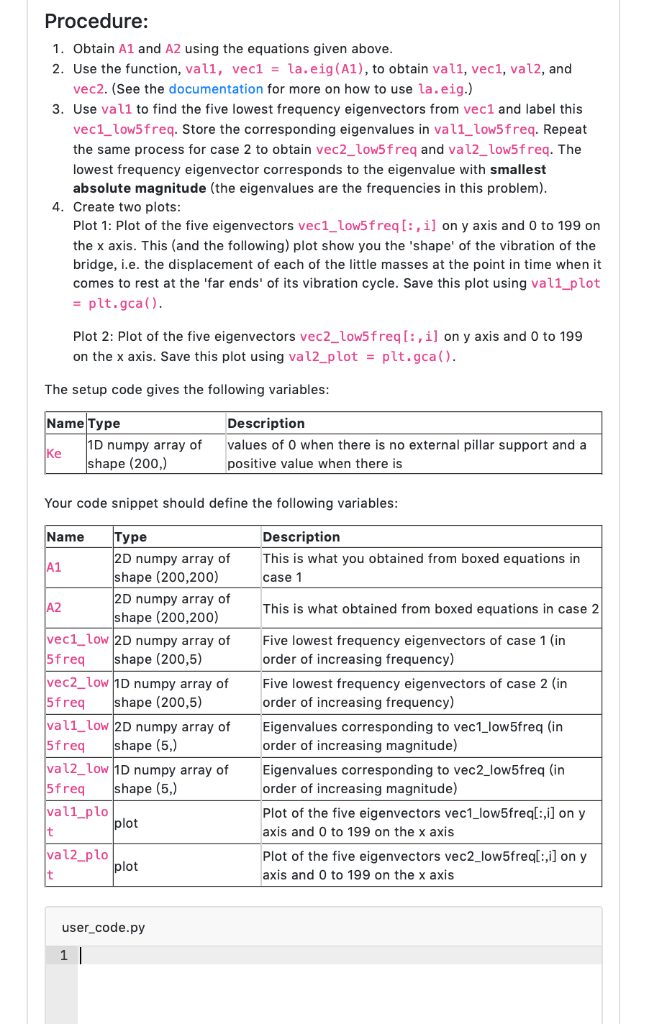
Eigenvalues and eigenvectors are important in Civil Engineering. All structures, from buildings to bridges, have natural frequencies of vibration. If external forces, like wind or earthquakes, provide energy to one of these natural frequencies at a rate faster than that with which damping dissipates it, vibrations with large amplitudes can occur. This is a phenomenon called resonance and it can be modeled as an eigenvalue problem. For some things (like guitar strings), that is desired. For some others (such as a tall building, or an airplane, or a bridge), this is less desirable The collapse of the Tacoma Narrows Bridge, pictured at the right, is a striking example of resonance. (t is actually a bit more complicated than that and is an example of a phenomenon called aeroelastic flutter.) Fortunately, the resulting math is fairly similar when modeled as resonance. To illustrate the problem, Wikipedia has some footage of the oscillations and the ensuing collapse and, if you're into that type of thing, a numerical simulation So vibration analysis of structures is a must at the time of their design using eigenvalues and eigenvectors to find these natural modes of vibration Vibration analysis and numerical solution: We will find the eigenvalues and eigenvectors of a simplified model of an unsupported bridge (case 1) and for a bridge supported by pillars (case 2). The unsupported bridge model consists of small masses m (200 of these) connected by springs. For the pillar- supported bridge model, we add extra springs on some of the 200 small masses to help simulate the effect of pillars. This spring-mass system will satisfy the Newton's law such that F-. a, where F is the spring force connecting the masses, and a is the acceleration of each small mass Am. You may also remember from your physics class that a spring force is defined as F--, where K is the spring stiffness (modeling the stiffness of the bridge) and Ay is the spring change in length when subject to the force F. Assuming that the mass-spring elements are vibrating in a state of simple harmonic motion, we can write the following equations of motion for the unsupported bridge model (you can find more detailed information here) Case 1: No supporting pillars for i 0, for i = 199 th fi is the vertical displacement of the imass. For a bridge supported by pillars at certain locations, we get the modified equations: Case 2: With supporting pillars for i = 0, fori 199 where Keli (provided as Ke in the code)is the stiffness of the extra springs that simulate the effect of the pillars. Note that we can set Ke = 0 for all bridge elements i with no pillar support. The equations above can be written in a matrix format as an eigenvalue problem where y 0,.y[199| . Your goal is to obtain two matrices A (A1 and A2 for cases 1 and 2 respectively) and solve the corresponding eigenvalue problems Procedure: 1. Obtain A1 and A2 using the equations given above 2. Use the function, vall, vec1 la.eig(A1), to obtain vall, vec1, val2, and vec2. (See the documentation for more on how to use la.eig.) 3. Use vall to find the five lowest frequency eigenvectors from vec1 and label this vec1_low5freq. Store the corresponding eigenvalues in vall_low5freq. Repeat the same process for case 2 to obtain vec2_low5freq and va12_low5freq. The lowest frequency eigenvector corresponds to the eigenvalue with smallest absolute magnitude (the eigenvalues are the frequencies in this problem) 4. Create two plots Plot 1: Plot of the five eigenvectors vec1_low5freq[:,i] on y axis and 0 to 199 on the x axis. This (and the following) plot show you the 'shape' of the vibration of the bridge, i.e. the displacement of each of the little masses at the point in time when it comes to rest at the 'far ends' of its vibration cycle. Save this plot using vall_plot plt.gca() Plot 2: Plot of the five eigenvectors vec2_low5freq[:,i] on y axis and 0 to 199 on the x axis. Save this plot using val2_plotplt.gca() The setup code gives the following variables Name Type Ke Description values of 0 when there is no external pillar support and a positive value when there is 1D numpy array of shape (200,) Your code snippet should define the following variables Name A1 2D numpy array of shape (200,200) 2D numpy array of shape (200,200) Description This is what you obtained from boxed equations in case 1 This is what obtained from boxed equations in case 2 vec1 low 2D numpy array of Five lowest frequency eigenvectors of case 1 (in 5freq vec2low1D numpy array of Five lowest frequency eigenvectors of case 2 (in freq shape (200,5) vall_low 2D numpy array of Eigenvalues corresponding to vec1_low5freq (in 5freq shape (5,) va12_low 1D numpy array of Eigenvalues corresponding to vec2_low5freq (in 5freq shape (5,) val1 plo shape (200,5) order of increasing frequency) order of increasing frequency) order of increasing magnitude) order of increasing magnitude) Plot of the five eigenvectors vec1_low5freq[:,i] on y axis and 0 to 199 on the x axis lot val2_plo Plot of the five eigenvectors vec2_low5freql:,i] on y axis and 0 to 199 on the x axis lot user code.py Eigenvalues and eigenvectors are important in Civil Engineering. All structures, from buildings to bridges, have natural frequencies of vibration. If external forces, like wind or earthquakes, provide energy to one of these natural frequencies at a rate faster than that with which damping dissipates it, vibrations with large amplitudes can occur. This is a phenomenon called resonance and it can be modeled as an eigenvalue problem. For some things (like guitar strings), that is desired. For some others (such as a tall building, or an airplane, or a bridge), this is less desirable The collapse of the Tacoma Narrows Bridge, pictured at the right, is a striking example of resonance. (t is actually a bit more complicated than that and is an example of a phenomenon called aeroelastic flutter.) Fortunately, the resulting math is fairly similar when modeled as resonance. To illustrate the problem, Wikipedia has some footage of the oscillations and the ensuing collapse and, if you're into that type of thing, a numerical simulation So vibration analysis of structures is a must at the time of their design using eigenvalues and eigenvectors to find these natural modes of vibration Vibration analysis and numerical solution: We will find the eigenvalues and eigenvectors of a simplified model of an unsupported bridge (case 1) and for a bridge supported by pillars (case 2). The unsupported bridge model consists of small masses m (200 of these) connected by springs. For the pillar- supported bridge model, we add extra springs on some of the 200 small masses to help simulate the effect of pillars. This spring-mass system will satisfy the Newton's law such that F-. a, where F is the spring force connecting the masses, and a is the acceleration of each small mass Am. You may also remember from your physics class that a spring force is defined as F--, where K is the spring stiffness (modeling the stiffness of the bridge) and Ay is the spring change in length when subject to the force F. Assuming that the mass-spring elements are vibrating in a state of simple harmonic motion, we can write the following equations of motion for the unsupported bridge model (you can find more detailed information here) Case 1: No supporting pillars for i 0, for i = 199 th fi is the vertical displacement of the imass. For a bridge supported by pillars at certain locations, we get the modified equations: Case 2: With supporting pillars for i = 0, fori 199 where Keli (provided as Ke in the code)is the stiffness of the extra springs that simulate the effect of the pillars. Note that we can set Ke = 0 for all bridge elements i with no pillar support. The equations above can be written in a matrix format as an eigenvalue problem where y 0,.y[199| . Your goal is to obtain two matrices A (A1 and A2 for cases 1 and 2 respectively) and solve the corresponding eigenvalue problems Procedure: 1. Obtain A1 and A2 using the equations given above 2. Use the function, vall, vec1 la.eig(A1), to obtain vall, vec1, val2, and vec2. (See the documentation for more on how to use la.eig.) 3. Use vall to find the five lowest frequency eigenvectors from vec1 and label this vec1_low5freq. Store the corresponding eigenvalues in vall_low5freq. Repeat the same process for case 2 to obtain vec2_low5freq and va12_low5freq. The lowest frequency eigenvector corresponds to the eigenvalue with smallest absolute magnitude (the eigenvalues are the frequencies in this problem) 4. Create two plots Plot 1: Plot of the five eigenvectors vec1_low5freq[:,i] on y axis and 0 to 199 on the x axis. This (and the following) plot show you the 'shape' of the vibration of the bridge, i.e. the displacement of each of the little masses at the point in time when it comes to rest at the 'far ends' of its vibration cycle. Save this plot using vall_plot plt.gca() Plot 2: Plot of the five eigenvectors vec2_low5freq[:,i] on y axis and 0 to 199 on the x axis. Save this plot using val2_plotplt.gca() The setup code gives the following variables Name Type Ke Description values of 0 when there is no external pillar support and a positive value when there is 1D numpy array of shape (200,) Your code snippet should define the following variables Name A1 2D numpy array of shape (200,200) 2D numpy array of shape (200,200) Description This is what you obtained from boxed equations in case 1 This is what obtained from boxed equations in case 2 vec1 low 2D numpy array of Five lowest frequency eigenvectors of case 1 (in 5freq vec2low1D numpy array of Five lowest frequency eigenvectors of case 2 (in freq shape (200,5) vall_low 2D numpy array of Eigenvalues corresponding to vec1_low5freq (in 5freq shape (5,) va12_low 1D numpy array of Eigenvalues corresponding to vec2_low5freq (in 5freq shape (5,) val1 plo shape (200,5) order of increasing frequency) order of increasing frequency) order of increasing magnitude) order of increasing magnitude) Plot of the five eigenvectors vec1_low5freq[:,i] on y axis and 0 to 199 on the x axis lot val2_plo Plot of the five eigenvectors vec2_low5freql:,i] on y axis and 0 to 199 on the x axis lot user code.py
Step by Step Solution
There are 3 Steps involved in it

Get step-by-step solutions from verified subject matter experts