

Question: Eivariate data for the quantitative variables { and { are given in the table below . ThesE data are plottEd in the scatter diagram Shown
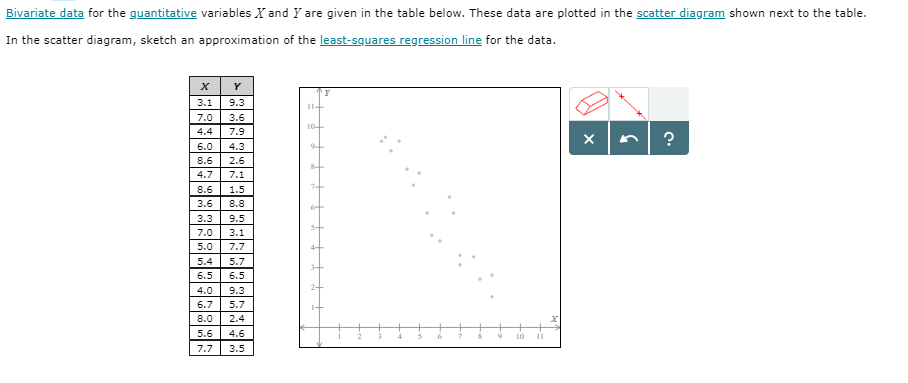
Eivariate data for the quantitative variables { and { are given in the table below . ThesE data are plottEd in the scatter diagram Shown next to the table . In the scatter diagram , Sketch an approximation of the lEast- squares regression line for the data . 3 . 1 \\5 . 3 11 - 7.0 \\3. 5 4, 4 7 . 5 10_| 5 . 0 4 . 3 8 . 5 2. 5 7. 1 8. 5 \\ 1 . 5 3.3 | 5. 5 7.0 | 3. 1 5.0\\\\ J . ] 5. 4 \\5 . 7 6. 5 | E. 5 4. 0 5 . 3 5 . 7 5 . 7 8.0 2 . 4 5. 5 4 . 5 . ] | 2. 5
Step by Step Solution
There are 3 Steps involved in it
1 Expert Approved Answer
Step: 1 Unlock

Question Has Been Solved by an Expert!
Get step-by-step solutions from verified subject matter experts
Step: 2 Unlock
Step: 3 Unlock