

Question: ivariate data for the quantitative variables x and y are given in the table below These data are plotted in the scatter plot shown next
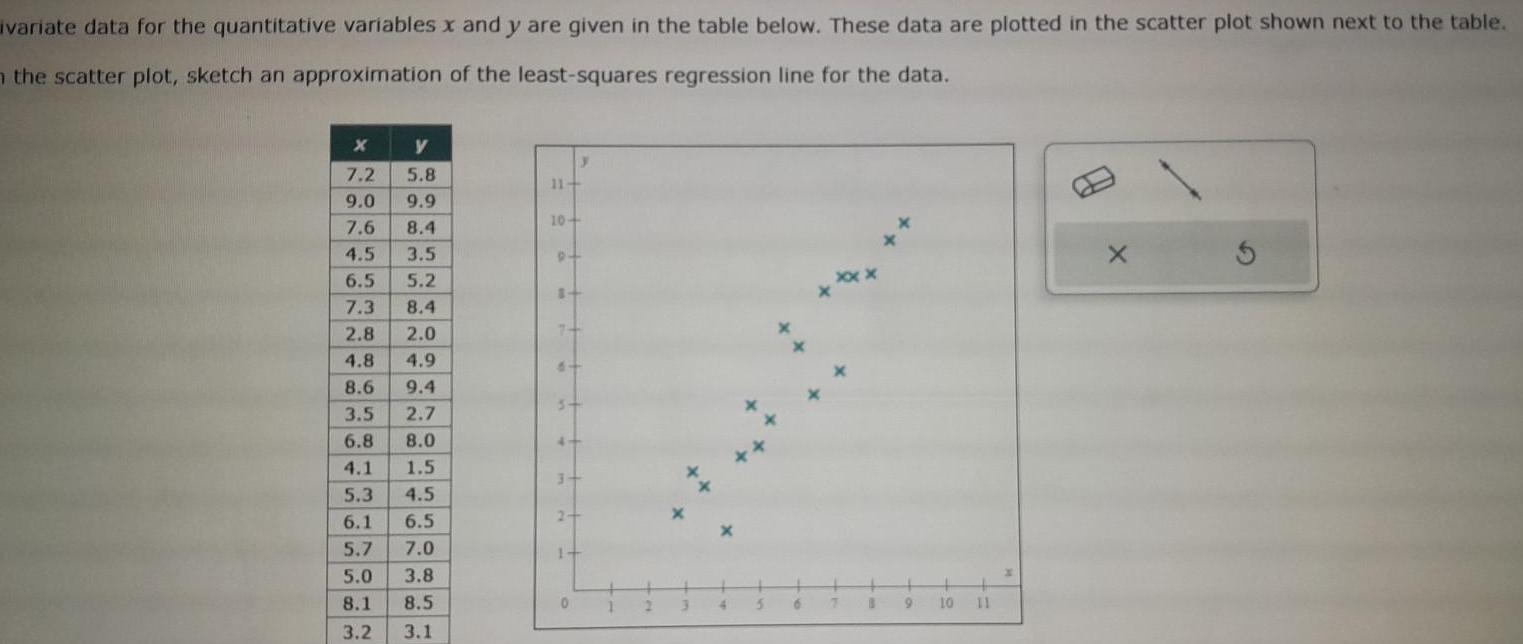

ivariate data for the quantitative variables x and y are given in the table below These data are plotted in the scatter plot shown next to the table the scatter plot sketch an approximation of the least squares regression line for the data COLL X y 7 2 5 8 9 0 9 9 7 6 8 4 4 5 3 5 6 5 5 2 7 3 8 4 2 8 2 0 4 8 4 9 8 6 9 4 3 5 2 7 6 8 8 0 4 1 1 5 5 3 4 5 6 1 6 5 5 7 7 0 5 0 3 8 8 1 8 5 3 2 3 1 11 10 9 8 6 5 3 24 1 0 1 2 3 4 5 6 xxx 7 B x 9 10 X S
Step by Step Solution
There are 3 Steps involved in it
1 Expert Approved Answer
Step: 1 Unlock

Question Has Been Solved by an Expert!
Get step-by-step solutions from verified subject matter experts
Step: 2 Unlock
Step: 3 Unlock