

Question: @El ED ' View Assessment E 2i 9 a 9i El El EJ ' Q Week 2 - MTH/217: Statistics | - Universit.. Question 9
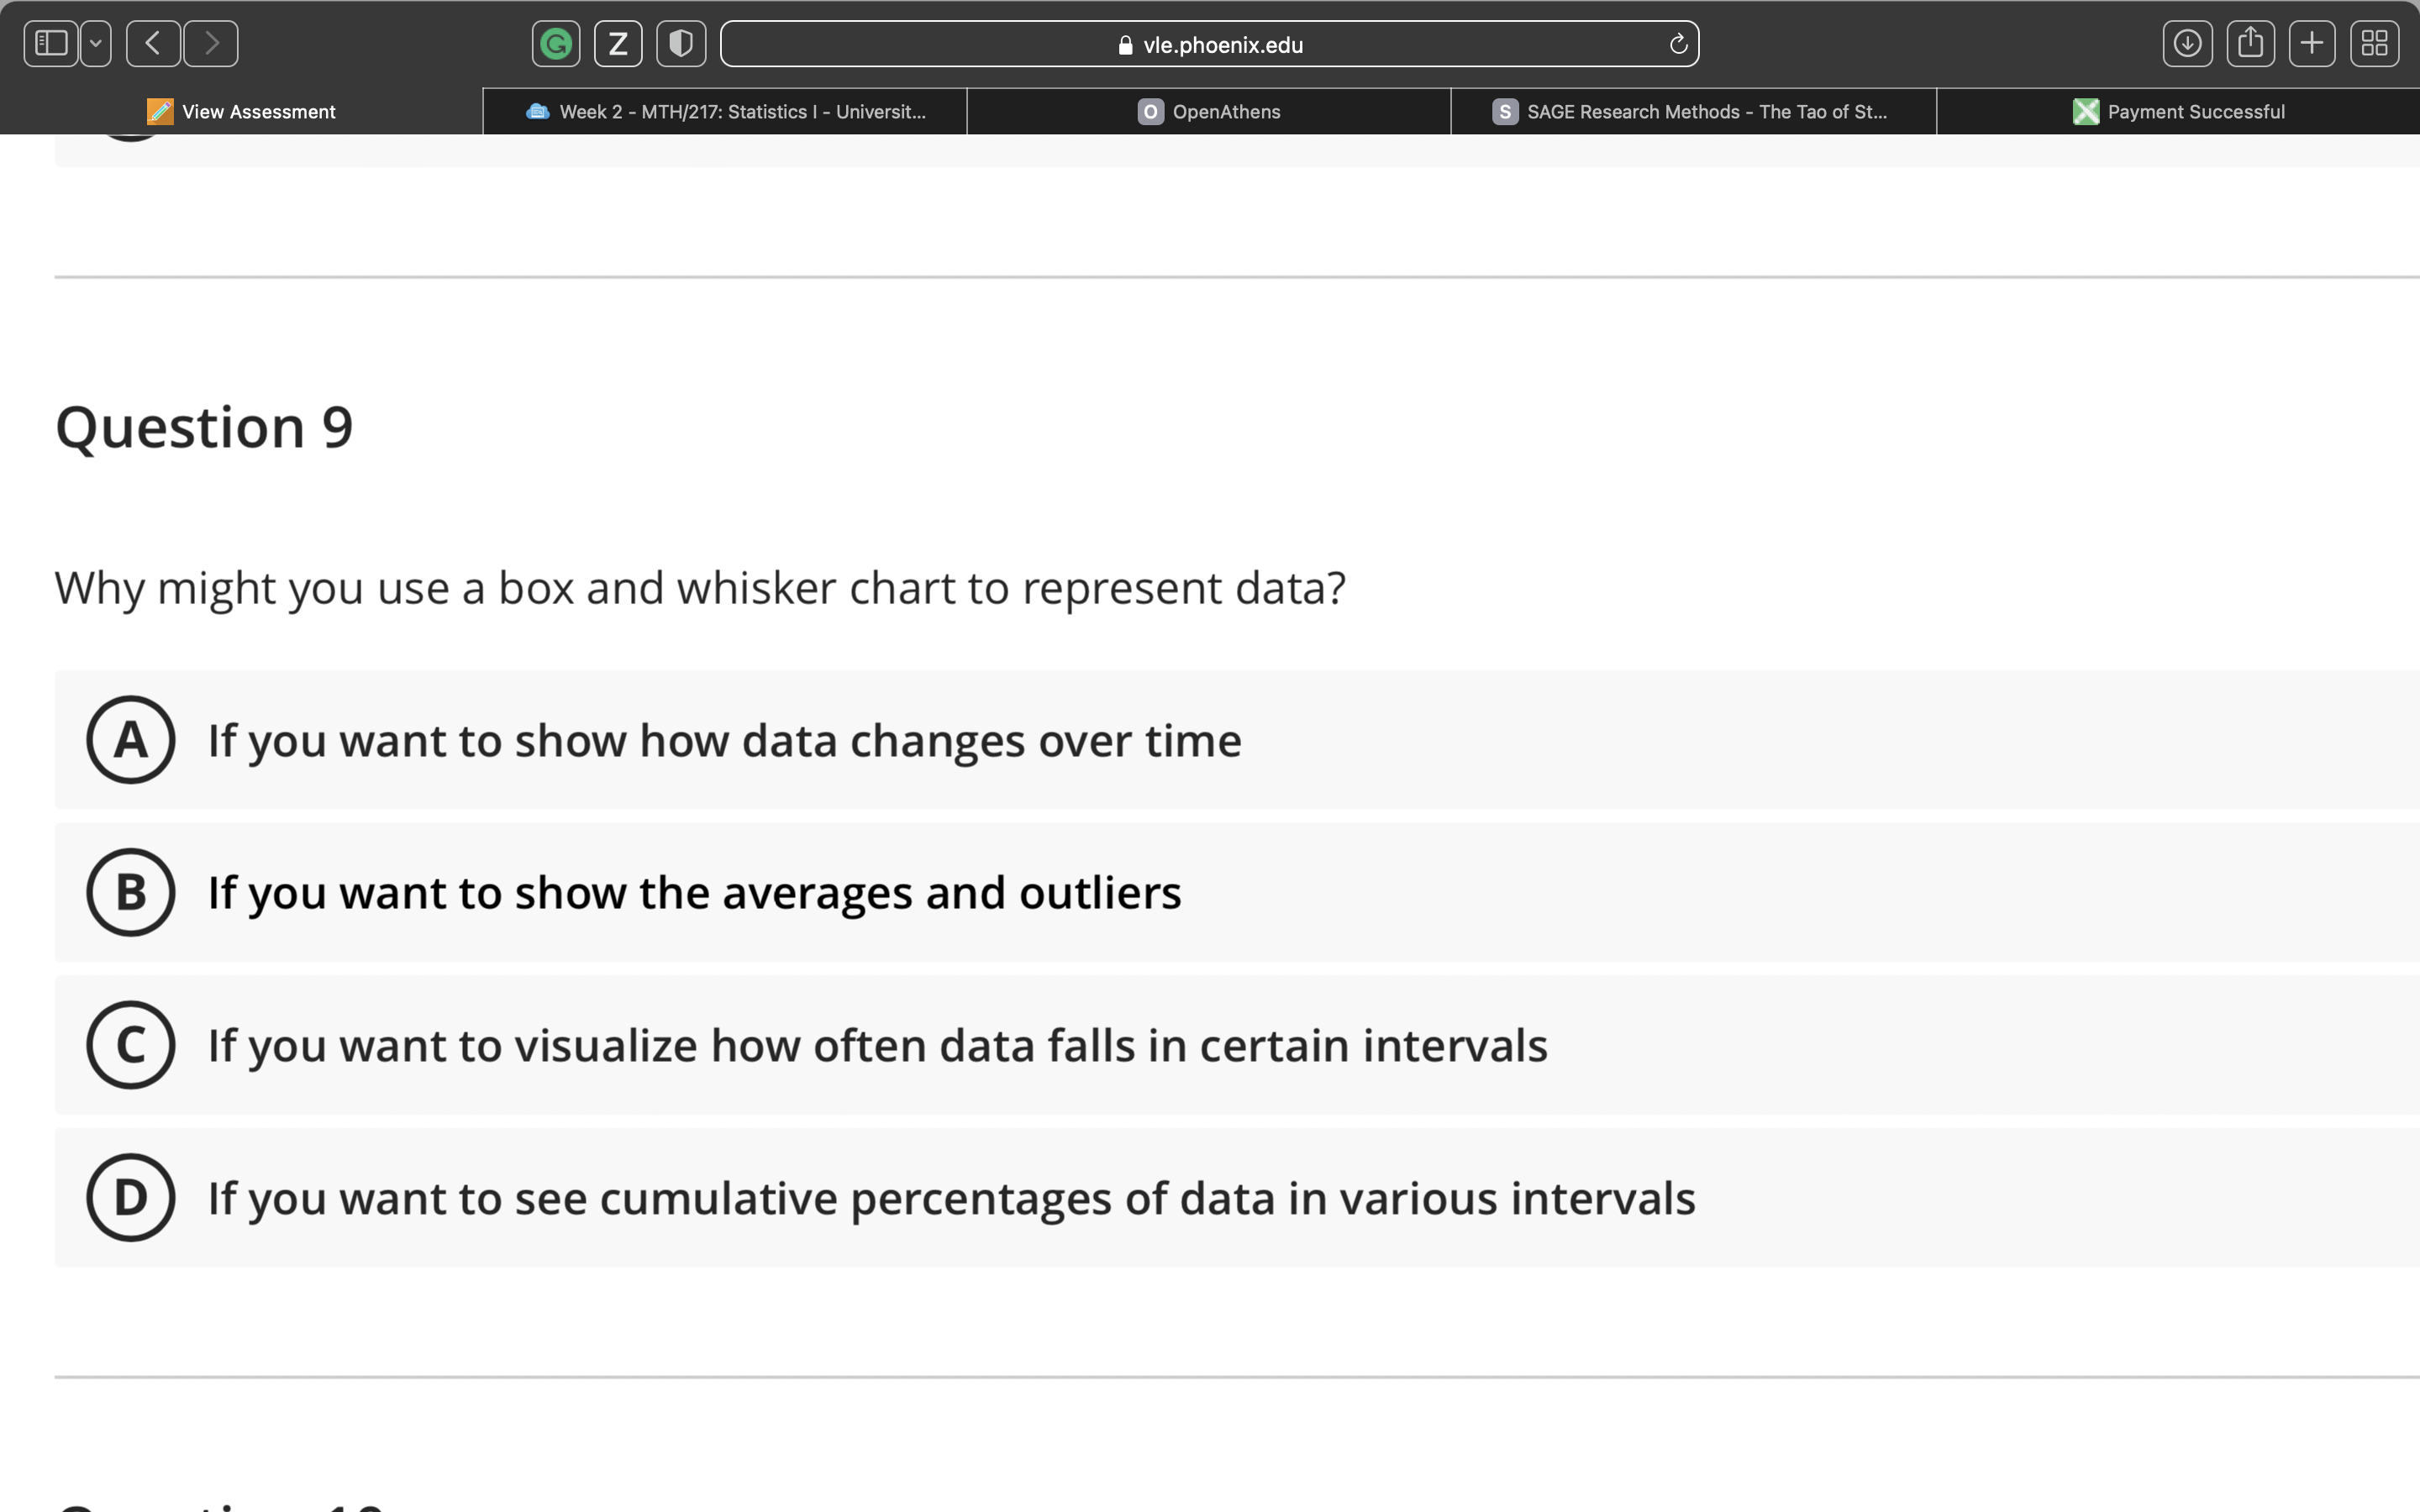

@El ED ' View Assessment E 2i 9 a 9i El El EJ ' Q Week 2 - MTH/217: Statistics | - Universit.. Question 9 Why might you use a box and whisker chart to represent data? Q) If you want to show how data changes over time If you want to show the averages and outliers If you want to visualize how often data falls in certain intervals @ If you want to see cumulative percentages of data in various intervals
Step by Step Solution
There are 3 Steps involved in it
1 Expert Approved Answer
Step: 1 Unlock

Question Has Been Solved by an Expert!
Get step-by-step solutions from verified subject matter experts
Step: 2 Unlock
Step: 3 Unlock