Elevated levels of blood urea nitrogen (BUN) denote poor kidney function. Ten elderly cats showing early signs
Question:
Elevated levels of blood urea nitrogen (BUN) denote poor kidney function. Ten elderly cats showing early signs of renal failure are randomly divided into two groups. Group 1 (control group) is placed on a standard high-protein diet. Group 2 (intervention group) is placed on a low-phosphorus high-protein diet. Their BUN is measured both initially and three months later. The data is shown in Table 5.20. Use α = 0.05 in all parts of this problem.
(a) Was there a significant increase in mean BUN for Group 1?
(b) Was there a significant increase in mean BUN for Group 2?
(c) Did the two groups differ in their mean change in BUN? If so, which appeared to have the least increase?
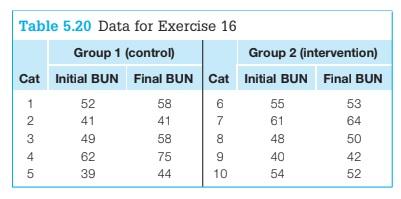
(d) Using the same BUN data above, test whether the variance of the change in BUN is the same in both groups.
Expert Answer:
Step 1 we are going to first to identify the test statistic For this case the test statistic is pair... View the full answer