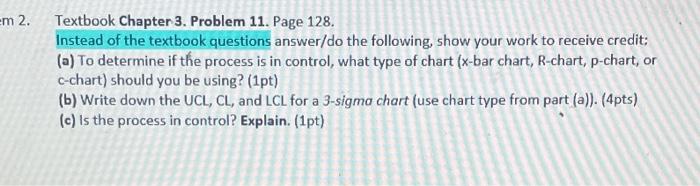
Question: Em 2. Textbook Chapter 3. Problem 11. Page 128. Instead of the textbook questions answer/do the following, show your work to receive credit: (a) To

Em 2. Textbook Chapter 3. Problem 11. Page 128.
Em 2. Textbook Chapter 3. Problem 11. Page 128. Instead of the textbook questions answer/do the following, show your work to receive credit: (a) To determine if the process is in control, what type of chart (x-bar chart, R-chart, p-chart, or c-chart) should you be using? (1pt) (b) Write down the UCL, CL, and LCL for a 3-sigma chart (use chart type from part (a)). (4pts) (c) is the process in control? Explain. (1pt) 11. Garcia's Garage desires to create some colorful charts and graphs to illustrate how reliably its mechanics "get under the hood and fix the problem." The historic average for the proportion of customers that return for the same repair within the 30-day warranty period is 0.10. Each month, Garcia tracks 100 customers to see whether they return for warranty repairs. The results are plotted as a proportion la report progress toward the goal. If the control limits are to be set at 2 standard deviations on either side of the goal, determine the control limits for this chart. In March, 8 of the 100 customers in the sample group returned for war- ranty repairs. Is the repair process in control

Step by Step Solution

There are 3 Steps involved in it

1 Expert Approved Answer
Step: 1 Unlock blur-text-image
Question Has Been Solved by an Expert!

Get step-by-step solutions from verified subject matter experts

Step: 2 Unlock
Step: 3 Unlock

Students Have Also Explored These Related General Management Questions!