

Question: Engineering design often involves measurement of a relevant property and then data analysis by plotting the data in.order.to probe a physical phenomenon. The goal of
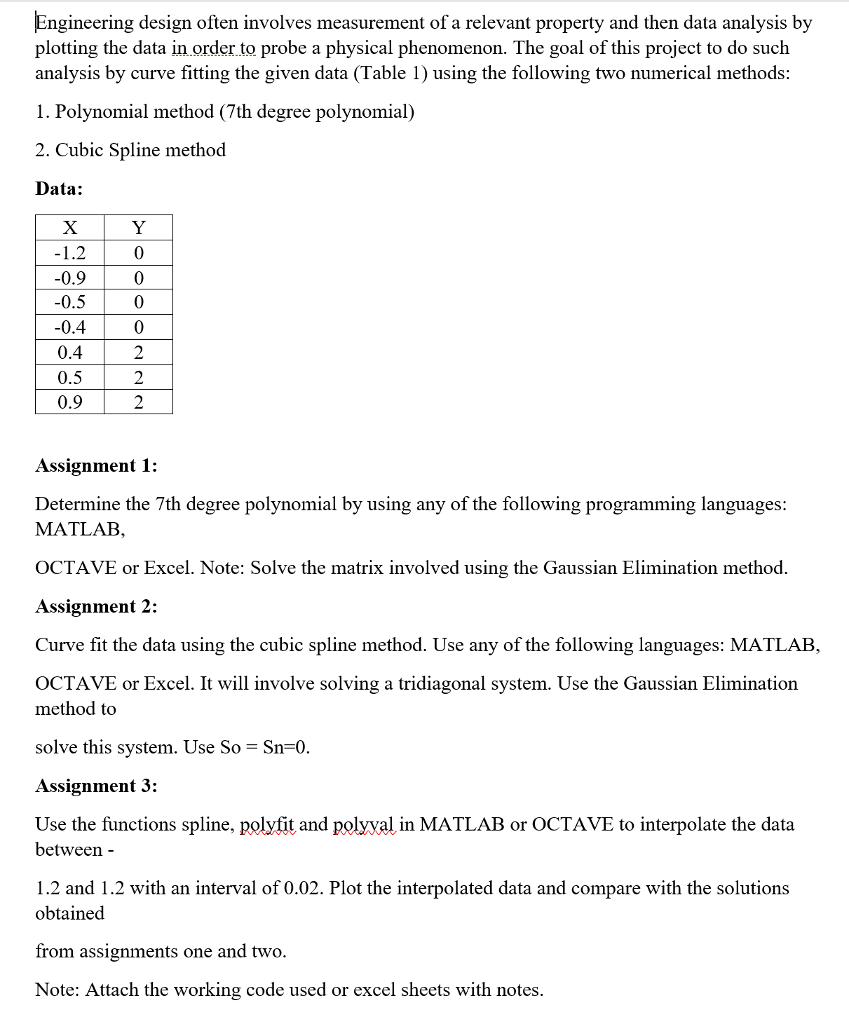
Engineering design often involves measurement of a relevant property and then data analysis by plotting the data in.order.to probe a physical phenomenon. The goal of this project to do such analysis by curve fitting the given data (Table 1) using the following two numerical methods: 1. Polynomial method (7th degree polynomial) 2. Cubic Spline method Data: 0 0.9 0.5 0.4 0.4 0.5 0.9 0 0 Assignment 1: Determine the 7th degree polynomial by using any of the following programming languages MATLAB OCTAVE or Excel. Note: Solve the matrix involved using the Gaussian Elimination method Assignment 2: Curve fit the data using the cubic spline method. Use any of the following languages: MATLAB OCTAVE or Excel. It will involve solving a tridiagonal system. Use the Gaussian Elimination method to solve this svstem. Use So-Sn-(0 Assignment 3: Use the functions spline, polyfit and polyval in MATLAB or OCTAVE to interpolate the data between - 1.2 and 1.2 with an interval of 0.02. Plot the interpolated data and compare with the solutions obtained from assignments one and two Note: Attach the working code used or excel sheets with notes
Step by Step Solution
There are 3 Steps involved in it

Get step-by-step solutions from verified subject matter experts