

Question: engineering management subject: designing for lean manufacturing topic is from lean manufacturing subject about metric profile imagine you are a head of a department what
engineering management 
subject: designing for lean manufacturing
topic is from lean manufacturing subject about metric profile 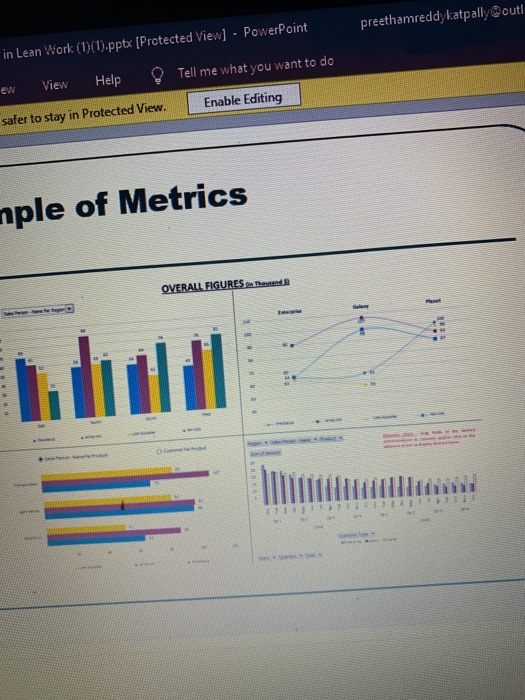
rformance Metrics 1. Develop two performance metrics following the format described in 'The Metric Profile of the lecture slides. Include all elements, including a picture of the metric (which may be created from actual data or your best estimate from experience). You will then write a description of how you, as a manager, would use this information in a tier meeting. rformance Metrics 1. Develop two performance metrics following the format described in "The Metric Profile" of the lecture slides. Include all elements, including a picture of the metric (which may be created from actual data or your best estimate from experience). You will then write a description of how you, as a manager, would use this information in a tier meeting preethamreddykatpally@out Daily Accountability in Lean Work (101.pptx [Protected View] - PowerPoint View Help Tell me what you want to do uns Review Slide Show Enable Editing Unless you need to edit, it's safer to stay in Protected View The Metric Profile Metric name. This one is obvious. A picture of the metric. It helps to know what it looks like or should look like (e.g., a line graph, a stacked bar chart). The purpose of the metric. Implications, aka the "So what?" Metric target. A good PDCA cycle usually requires targets. etric, then decide how it will best be displayed. It's very important to understand the "why" of the metric. For to the linearity or level of production day over day. It's also important to understand the implications of the e-production run chart reflects less than the estimated level of production (here an upper and lower controllin te the root causes. Potential root causes can include demand variation overproduction and capacity constrain Comments E B preethamreddykatpally@outl in Lean Work (1)(1).pptx [Protected View] - PowerPoint ew Tell me what you want to do View Help Enable Editing safer to stay in Protected View nple of Metrics OVERALL FIGURES The
imagine you are a head of a department what you will do to develop the stats of the product
we need two metric charts to show development and explain how to 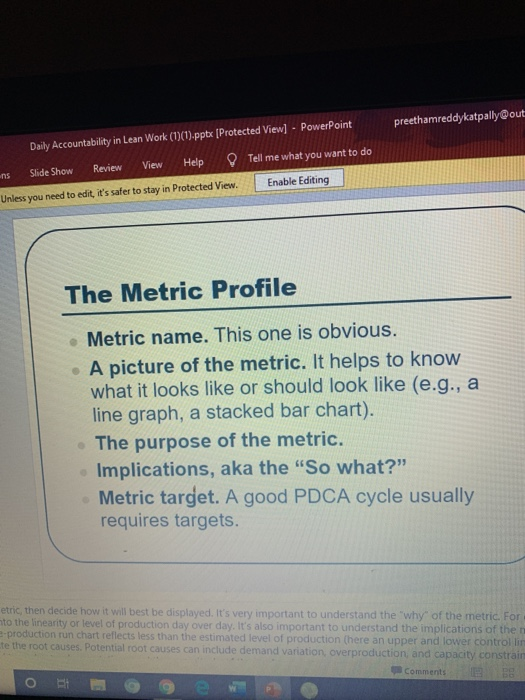
Step by Step Solution
There are 3 Steps involved in it
1 Expert Approved Answer
Step: 1 Unlock

Question Has Been Solved by an Expert!
Get step-by-step solutions from verified subject matter experts
Step: 2 Unlock
Step: 3 Unlock