

Question: Engineering problem solving Use Microsoft Excel then take a picture when you are done 3. Using the given data, develop a spreadsheet and generate the
Engineering problem solving
Use Microsoft Excel then take a picture when you are done
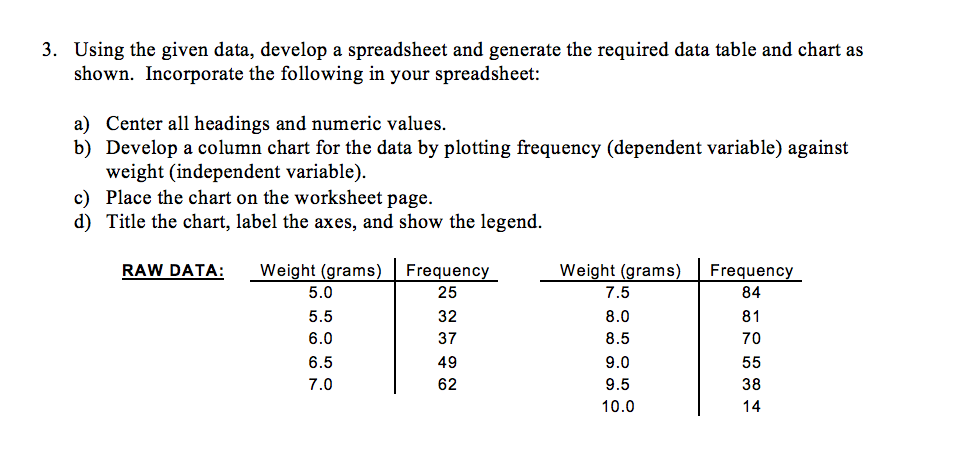
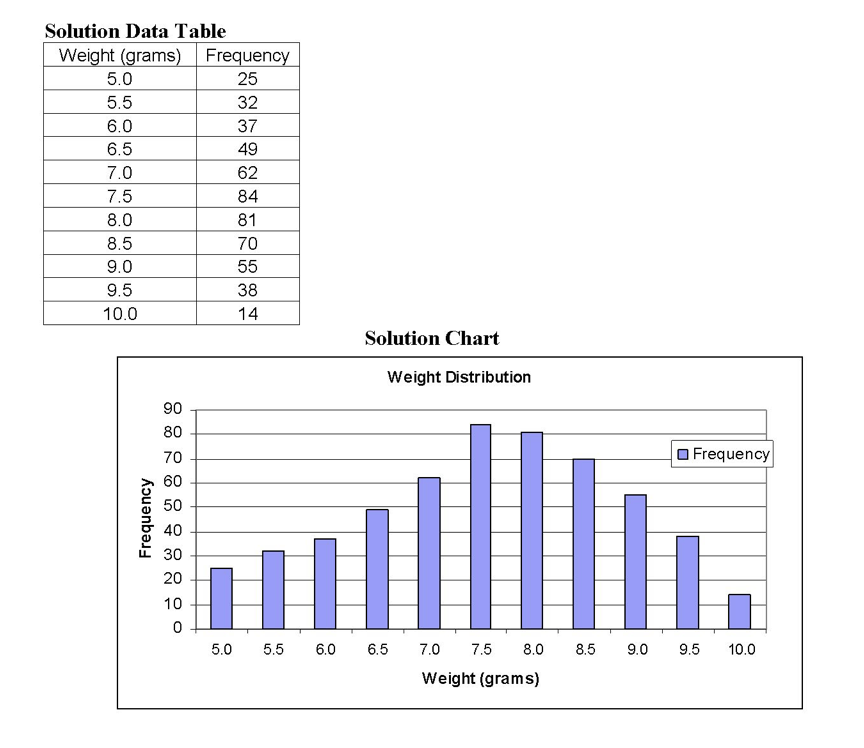
3. Using the given data, develop a spreadsheet and generate the required data table and chart as shown. Incorporate the following in your spreadsheet: a) Center all headings and numeric values. b) Develop a column chart for the data by plotting frequency (dependent variable) against weight (independent variable). c) Place the chart on the worksheet page. d) Title the chart, label the axes, and show the legend. RAW DATA: Frequency 84 Weight (grams) 5.0 5.5 6.0 6.5 7.0 Frequency 25 32 37 49 62 Weight (grams) 7.5 8.0 8.5 9.0 9.5 10.0 81 70 55 38 14 Solution Data Table Weight (grams) Frequency 5.0 25 5.5 32 6.0 37 6.5 49 7.0 62 7.5 84 8.0 81 8.5 70 9.0 55 9.5 38 10.0 14 Solution Chart Weight Distribution 90 80 70 Frequency 60 Frequency 50 40 30 20 1. 10 0 5.0 5.5 6.0 6.5 7.0 7.5 8.0 8.5 9.0 9.5 10.0 Weight (grams)
Step by Step Solution
There are 3 Steps involved in it

Get step-by-step solutions from verified subject matter experts