

Question: Engineers in industry must continually look for ways to make their designs and operations more efficient. One way of doing so is optimisation, which uses
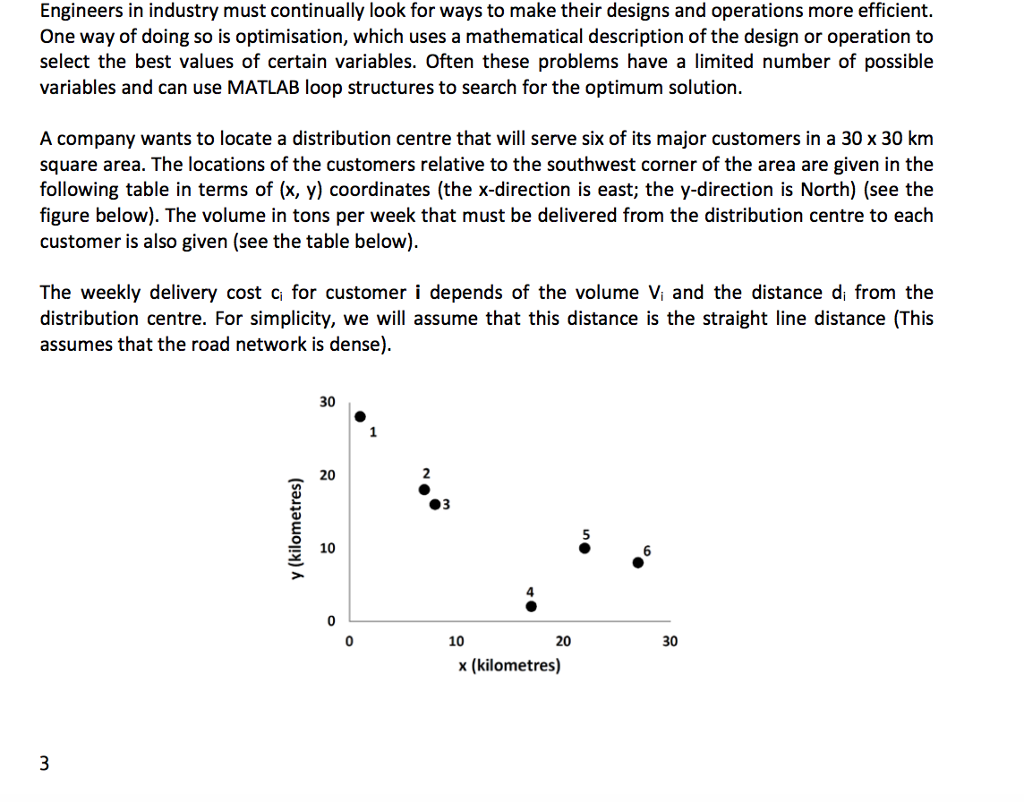
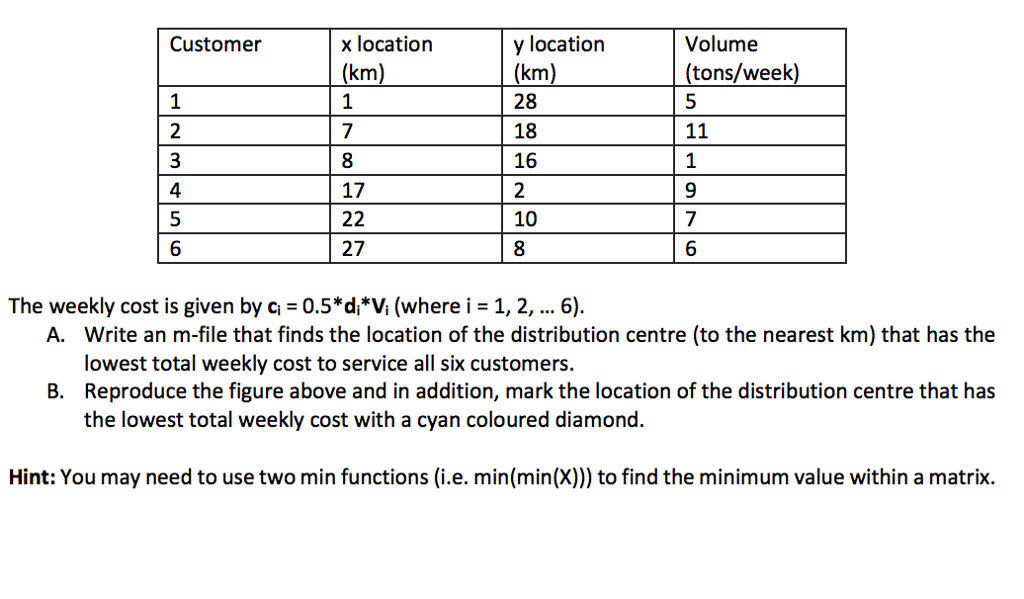
Engineers in industry must continually look for ways to make their designs and operations more efficient. One way of doing so is optimisation, which uses a mathematical description of the design or operation to select the best values of certain variables. Often these problems have a limited number of possible variables and can use MATLAB loop structures to search for the optimum solution. A company wants to locate a distribution centre that will serve six of its major customers in a 30 x 30 km square area. The locations of the customers relative to the southwest corner of the area are given in the following table in terms of (x, y) coordinates (the x-direction is east; the y-direction is North) (see the figure below). The volume in tons per week that must be delivered from the distribution centre to each customer is also given (see the table below) The weekly delivery cost ci for customer i depends of the volume Vi and the distance di from the distribution centre. For simplicity, we will assume that this distance is the straight line distance (This assumes that the road network is dense). 30 20 10 10 20 30 x (kilometres) Engineers in industry must continually look for ways to make their designs and operations more efficient. One way of doing so is optimisation, which uses a mathematical description of the design or operation to select the best values of certain variables. Often these problems have a limited number of possible variables and can use MATLAB loop structures to search for the optimum solution. A company wants to locate a distribution centre that will serve six of its major customers in a 30 x 30 km square area. The locations of the customers relative to the southwest corner of the area are given in the following table in terms of (x, y) coordinates (the x-direction is east; the y-direction is North) (see the figure below). The volume in tons per week that must be delivered from the distribution centre to each customer is also given (see the table below) The weekly delivery cost ci for customer i depends of the volume Vi and the distance di from the distribution centre. For simplicity, we will assume that this distance is the straight line distance (This assumes that the road network is dense). 30 20 10 10 20 30 x (kilometres)
Step by Step Solution
There are 3 Steps involved in it

Get step-by-step solutions from verified subject matter experts