

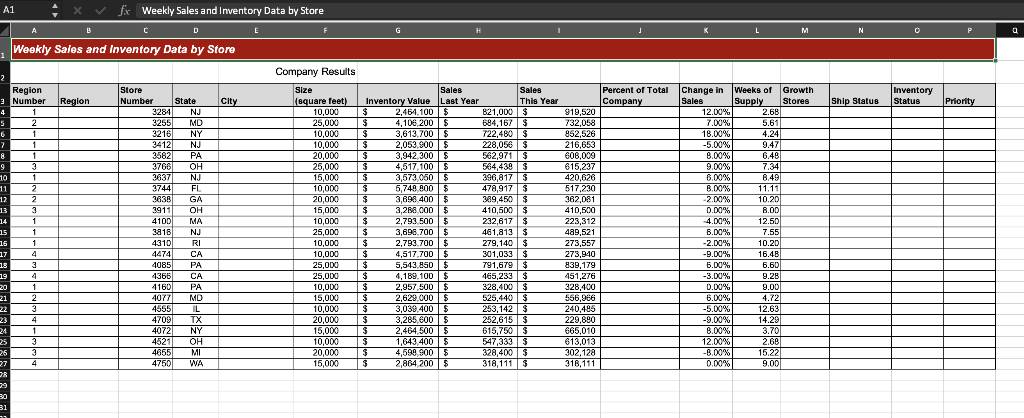
Question: Enter a SUM function in cell G2 on the Sales and Inventory worksheet. The SUM function should sum the values in the Inventory Value column.
- Enter a SUM function in cell G2 on the Sales and Inventory worksheet. The SUM function should sum the values in the Inventory Value column. Add cell capacity to the function to include Row 40.
- Copy cell G2 and paste it into cells H2 and I2.
- Enter an VLOOKUP function in cell B4 on the Sales and Inventory worksheet that will show the region name from the Region Plan worksheet. The lookup_value argument should be defined with cell A4 on the Sales and Inventory worksheet. The table_array argument should be the range A3:D6 on the Region Plan worksheet. Place an absolute reference on this range. The column_index_num argument should be the number 2 and the range_lookup argument should be the word FALSE.
- Copy cell B4 and paste it into the range B5:B27.
- Enter a VLOOKUP function in cell E4 on the Sales and Inventory worksheet that will show the city for each store from the Store Details worksheet. The lookup_value argument should be defined with cell C4 on the Sales and Inventory worksheet. The table_array argument should be the range A3:F26 on the Store Details worksheet. Place an absolute reference on this range. The col_index_num argument should be the number 5 and the range_lookup argument should be the word FALSE.
- Copy cell E4 and paste it into the range E5:E27.
- Enter a formula in cell J4 that divides cell I4 by I2. Place an absolute reference on cell I2.
- Copy cell J4 and paste it into the range J5:J27.
- Enter an IF function in cell M4 to determine if a store is a high growth exception. If the value in cell K4 is greater than 5%, then the output of the function should be the word Growth. Otherwise, there should be no output for the function. The logical_test argument should be K4>5%. The value_if_true argument should be the word Growth and must be enclosed in quotations. The value_if_false argument should be two quotations to leave the cell blank.
- Copy cell M4 and paste it into the range M5:M27.
- Begin an IF function in cell N4 on the Sales and Inventory worksheet. The purpose of this function is to determine if it is OK to deliver inventory to a store or if the delivery should be postponed. It can be a problem for smaller stores if too much inventory is delivered. For this company, a small store is 10,000 square feet.
- Define the logical_test argument of the IF function by using the AND function. The first logical test of the AND function should determine if cell F4 is equal to 10000. The second logical test of the AND function should determine if cell L4 is greater than 8. Cell L4 contains the weeks of supply which is a calculation that shows how fast the store is selling its current inventory. A high weeks of supply indicates that a store may have too much inventory relative to sales.
- Define that value_if_true argument of the IF function with the word Hold. Based on the results of the AND function, if a store is 10,000 square feet and the weeks of supply is greater than 8, the output of the function should be the word Hold.
- Define the value_if_false argument with the word OK.
- Copy cell N4 and paste it into the range N5:N27.
- Enter a nested IF function in cell O4 to identify the inventory status for each store. The inventory status will be determined based on the value in the Weeks of Supply column. The logical test of the first IF function should determine if cell L4 is less than 4. If this logical test is true, the output of the function should be the word Low. Start a second IF function in the value_if_false argument of the first IF function. The logical test of the second IF function should determine if the value in cell L4 is greater than 8. If this logical test is true, the output of the function should be the word High. If this logical test is not true, the function should output the word Normal. The word Normal should be used to define the value_if_false argument of the second IF function.
- Copy cell O4 and paste it into the range O5:O27.
- Enter an IF function in cell P4 that determines if a store should be identified as a priority delivery. Use the OR function to define the logical_test argument of the IF function. The first logical test of the OR function should determine if cell K4 is greater than 8%. The second logical test of the OR function should determine if cell L4 is less than 4. If the output of the OR function is true, the output of the IF function should be the word Priority. If the output of the OR function is not true, the IF function should leave the cell blank. Therefore, define the value_if_false argument of the IF function with two quotations.
- Copy cell P4 and paste it into the range P5:P27.
- Enter an IF function in cell A2 that will alert the user if data has been added to the worksheet that exceeds the cell capacity in the SUM functions in the range G2:I2. Use the ISBLANK function in the logical_test argument of the IF function. The ISBLANK function should determine if cell A41 is blank. If the output of the ISBLANK is true, then the output of the IF function should be a blank cell. If the output of the ISBLANK function is false, the output of the function should be: Report totals are missing data!.
- Apply the traffic light icon set from the conditional formatting list of options to the Weeks of Supply column. Highlight the range L4:L40 to add cell capacity to this conditional format. After selecting the More Rules option from the Icon Sets sub menu, make the following rule change to the green and yellow circles in the New Formatting Rule dialog box: Set the type for each circle to Number. Set the value for the green circle to 8 and set the value for the yellow circle to 4. Any weeks of supply that is less than 4 will be assigned a red circle. These are stores that might be in danger of running out of inventory.
- Save and close your workbook.
 Be sure to show excel formulas
Step by Step Solution
There are 3 Steps involved in it
1 Expert Approved Answer
Step: 1 Unlock

Question Has Been Solved by an Expert!
Get step-by-step solutions from verified subject matter experts
Step: 2 Unlock
Step: 3 Unlock