

Question: Enter and execute the three command lines below to install and activate the Tidyverse package (a collection of packages designed to help with data
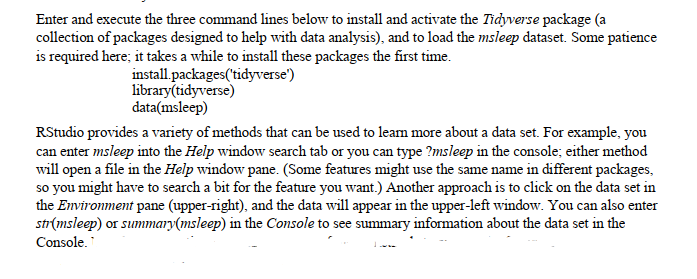
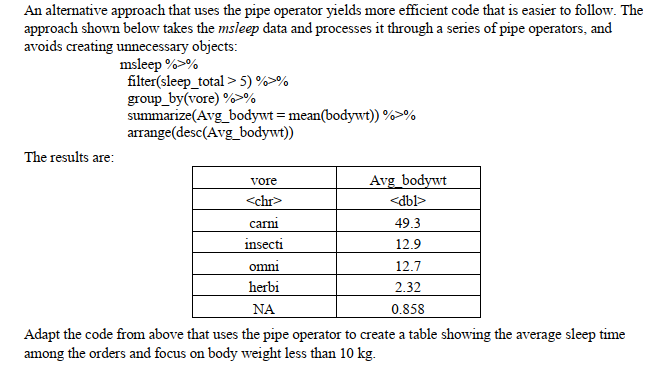
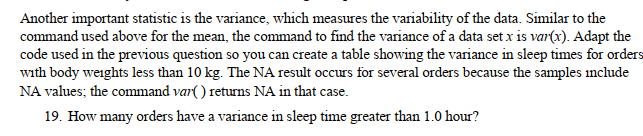
Enter and execute the three command lines below to install and activate the Tidyverse package (a collection of packages designed to help with data analysis), and to load the msleep dataset. Some patience is required here; it takes a while to install these packages the first time. install packages('tidyverse') library(tidyverse) data(msleep) RStudio provides a variety of methods that can be used to learn more about a data set. For example, you can enter msleep into the Help window search tab or you can type ?msleep in the console; either method will open a file in the Help window pane. (Some features might use the same name in different packages, so you might have to search a bit for the feature you want.) Another approach is to click on the data set in the Environment pane (upper-right), and the data will appear in the upper-left window. You can also enter str(msleep) or summary(msleep) in the Console to see summary information about the data set in the Console. An alternative approach that uses the pipe operator yields more efficient code that is easier to follow. The approach shown below takes the msleep data and processes it through a series of pipe operators, and avoids creating unnecessary objects: The results are: msleep %>% filter(sleep_total > 5)%>% group_by(vore) %>% summarize(Avg_bodywt = mean(bodywt))%>% arrange(desc(Avg_bodywt)) vore carni insecti omni herbi Avg_bodywt 49.3 12.9 12.7 2.32 0.858 Adapt the code from above that uses the pipe operator to create a table showing the average sleep time among the orders and focus on body weight less than 10 kg. Another important statistic is the variance, which measures the variability of the data. Similar to the command used above for the mean, the command to find the variance of a data set x is var(x). Adapt the code used in the previous question so you can create a table showing the variance in sleep times for orders with body weights less than 10 kg. The NA result occurs for several orders because the samples include NA values; the command var() returns NA in that case. 19. How many orders have a variance in sleep time greater than 1.0 hour?
Step by Step Solution
There are 3 Steps involved in it

Get step-by-step solutions from verified subject matter experts