

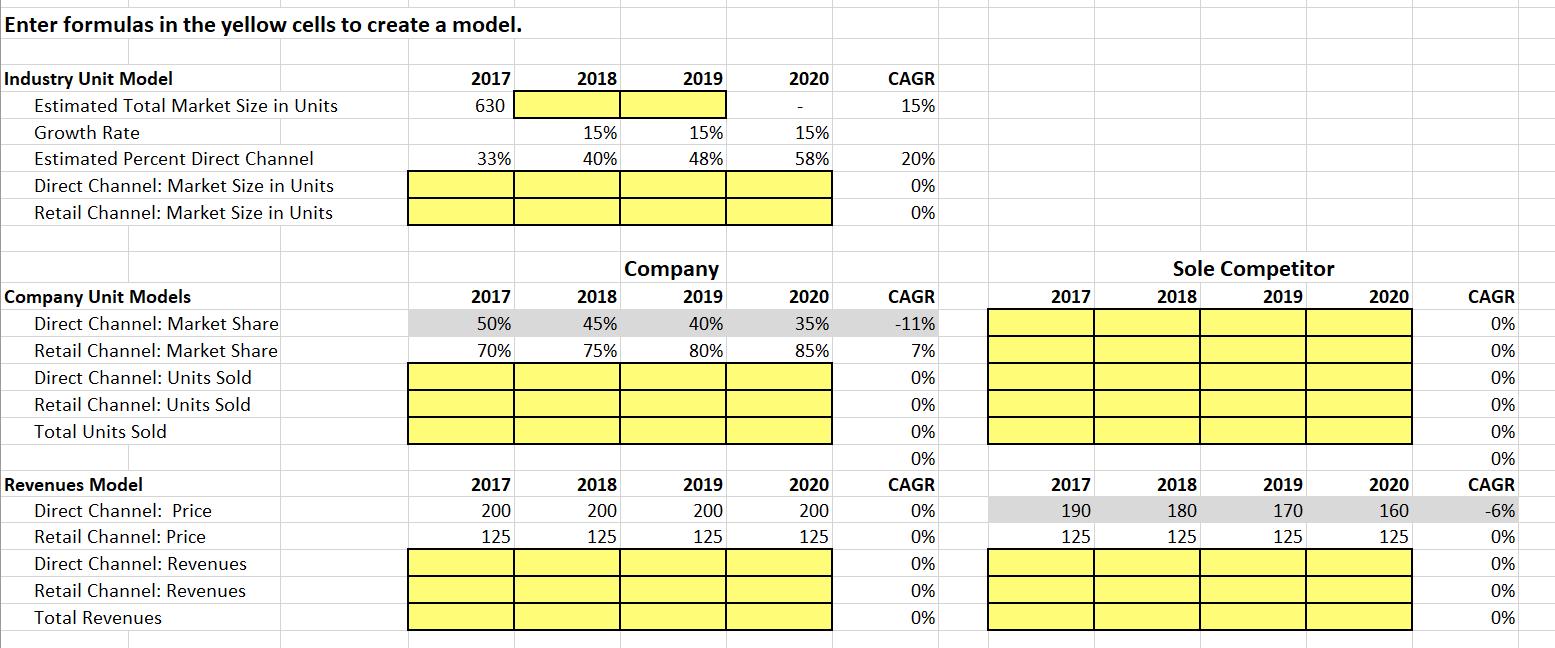
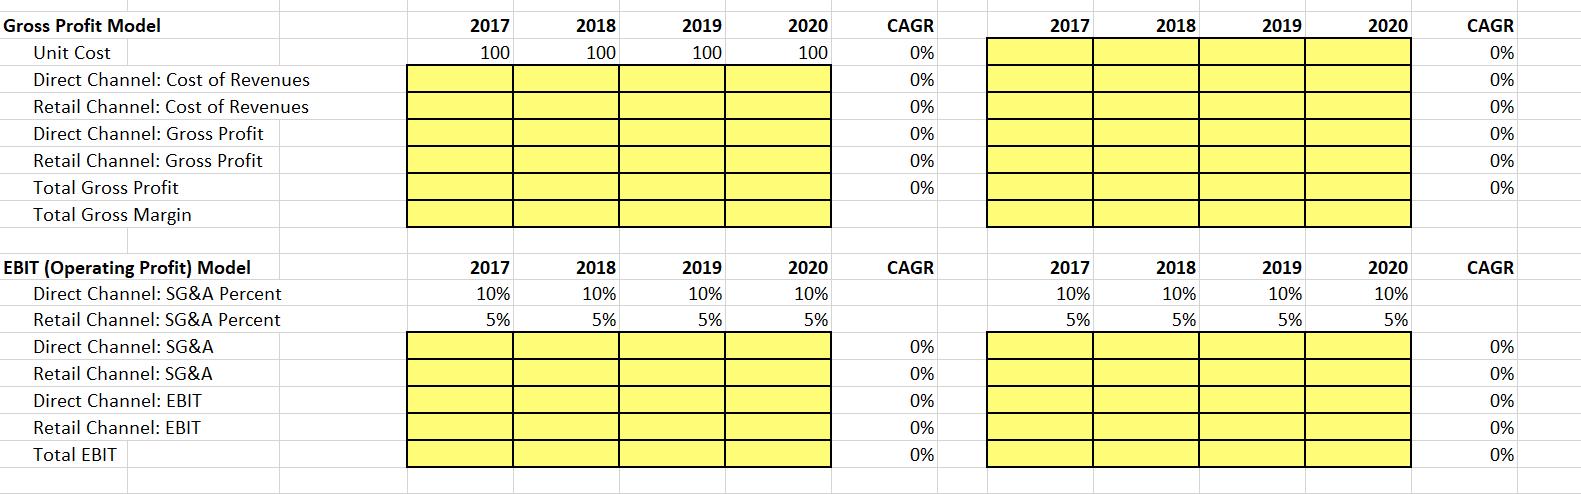
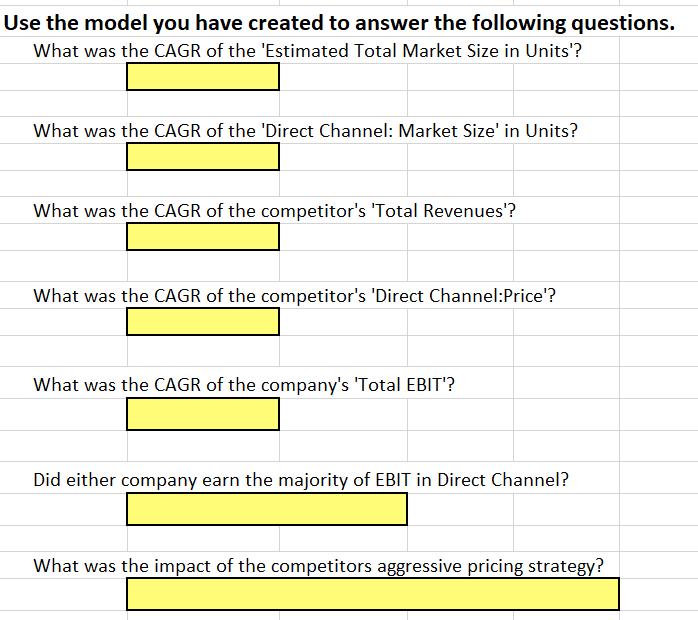
Enter formulas in the yellow cells to create a model. Industry Unit Model Estimated Total Market...
Fantastic news! We've Found the answer you've been seeking!
Question:
Transcribed Image Text:
Enter formulas in the yellow cells to create a model. Industry Unit Model Estimated Total Market Size in Units Growth Rate Estimated Percent Direct Channel Direct Channel: Market Size in Units Retail Channel: Market Size in Units Company Unit Models Direct Channel: Market Share Retail Channel: Market Share Direct Channel: Units Sold Retail Channel: Units Sold Total Units Sold Revenues Model Direct Channel: Price Retail Channel: Price Direct Channel: Revenues Retail Channel: Revenues Total Revenues 2017 630 33% 2017 50% 70% 2017 200 125 2018 15% 40% 2018 45% 75% 2018 200 125 2019 15% 48% Company 2019 40% 80% 2019 200 125 2020 15% 58% 2020 35% 85% 2020 200 125 CAGR 15% 20% 0% 0% CAGR -11% 7% 0% 0% 0% 0% CAGR 0% 0% 0% 0% 0% 2017 2017 190 125 Sole Competitor 2018 2019 2018 180 125 2019 170 125 2020 2020 160 125 CAGR 0% 0% 0% 0% 0% 0% CAGR -6% 0% 0% 0% 0% Gross Profit Model Unit Cost Direct Channel: Cost of Revenues Retail Channel: Cost of Revenues Direct Channel: Gross Profit Retail Channel: Gross Profit Total Gross Profit Total Gross Margin EBIT (Operating Profit) Model Direct Channel: SG&A Percent Retail Channel: SG&A Percent Direct Channel: SG&A Retail Channel: SG&A Direct Channel: EBIT Retail Channel: EBIT Total EBIT 2017 100 2017 10% 5% 2018 100 2018 10% 5% 2019 100 2019 10% 5% 2020 100 2020 10% 5% CAGR 0% 0% 0% 0% 0% 0% CAGR 0% 0% 0% 0% 0% 2017 2017 10% 5% 2018 2018 10% 5% 2019 2019 10% 5% 2020 2020 10% 5% CAGR 0% 0% 0% 0% 0% 0% CAGR 0% 0% 0% 0% 0% Use the model you have created to answer the following questions. What was the CAGR of the 'Estimated Total Market Size in Units'? What was the CAGR of the 'Direct Channel: Market Size' in Units? What was the CAGR of the competitor's 'Total Revenues'? What was the CAGR of the competitor's 'Direct Channel:Price'? What was the CAGR of the company's 'Total EBIT'? Did either company earn the majority of EBIT in Direct Channel? What was the impact of the competitors aggressive pricing strategy? Enter formulas in the yellow cells to create a model. Industry Unit Model Estimated Total Market Size in Units Growth Rate Estimated Percent Direct Channel Direct Channel: Market Size in Units Retail Channel: Market Size in Units Company Unit Models Direct Channel: Market Share Retail Channel: Market Share Direct Channel: Units Sold Retail Channel: Units Sold Total Units Sold Revenues Model Direct Channel: Price Retail Channel: Price Direct Channel: Revenues Retail Channel: Revenues Total Revenues 2017 630 33% 2017 50% 70% 2017 200 125 2018 15% 40% 2018 45% 75% 2018 200 125 2019 15% 48% Company 2019 40% 80% 2019 200 125 2020 15% 58% 2020 35% 85% 2020 200 125 CAGR 15% 20% 0% 0% CAGR -11% 7% 0% 0% 0% 0% CAGR 0% 0% 0% 0% 0% 2017 2017 190 125 Sole Competitor 2018 2019 2018 180 125 2019 170 125 2020 2020 160 125 CAGR 0% 0% 0% 0% 0% 0% CAGR -6% 0% 0% 0% 0% Gross Profit Model Unit Cost Direct Channel: Cost of Revenues Retail Channel: Cost of Revenues Direct Channel: Gross Profit Retail Channel: Gross Profit Total Gross Profit Total Gross Margin EBIT (Operating Profit) Model Direct Channel: SG&A Percent Retail Channel: SG&A Percent Direct Channel: SG&A Retail Channel: SG&A Direct Channel: EBIT Retail Channel: EBIT Total EBIT 2017 100 2017 10% 5% 2018 100 2018 10% 5% 2019 100 2019 10% 5% 2020 100 2020 10% 5% CAGR 0% 0% 0% 0% 0% 0% CAGR 0% 0% 0% 0% 0% 2017 2017 10% 5% 2018 2018 10% 5% 2019 2019 10% 5% 2020 2020 10% 5% CAGR 0% 0% 0% 0% 0% 0% CAGR 0% 0% 0% 0% 0% Use the model you have created to answer the following questions. What was the CAGR of the 'Estimated Total Market Size in Units'? What was the CAGR of the 'Direct Channel: Market Size' in Units? What was the CAGR of the competitor's 'Total Revenues'? What was the CAGR of the competitor's 'Direct Channel:Price'? What was the CAGR of the company's 'Total EBIT'? Did either company earn the majority of EBIT in Direct Channel? What was the impact of the competitors aggressive pricing strategy? Enter formulas in the yellow cells to create a model. Industry Unit Model Estimated Total Market Size in Units Growth Rate Estimated Percent Direct Channel Direct Channel: Market Size in Units Retail Channel: Market Size in Units Company Unit Models Direct Channel: Market Share Retail Channel: Market Share Direct Channel: Units Sold Retail Channel: Units Sold Total Units Sold Revenues Model Direct Channel: Price Retail Channel: Price Direct Channel: Revenues Retail Channel: Revenues Total Revenues 2017 630 33% 2017 50% 70% 2017 200 125 2018 15% 40% 2018 45% 75% 2018 200 125 2019 15% 48% Company 2019 40% 80% 2019 200 125 2020 15% 58% 2020 35% 85% 2020 200 125 CAGR 15% 20% 0% 0% CAGR -11% 7% 0% 0% 0% 0% CAGR 0% 0% 0% 0% 0% 2017 2017 190 125 Sole Competitor 2018 2019 2018 180 125 2019 170 125 2020 2020 160 125 CAGR 0% 0% 0% 0% 0% 0% CAGR -6% 0% 0% 0% 0% Gross Profit Model Unit Cost Direct Channel: Cost of Revenues Retail Channel: Cost of Revenues Direct Channel: Gross Profit Retail Channel: Gross Profit Total Gross Profit Total Gross Margin EBIT (Operating Profit) Model Direct Channel: SG&A Percent Retail Channel: SG&A Percent Direct Channel: SG&A Retail Channel: SG&A Direct Channel: EBIT Retail Channel: EBIT Total EBIT 2017 100 2017 10% 5% 2018 100 2018 10% 5% 2019 100 2019 10% 5% 2020 100 2020 10% 5% CAGR 0% 0% 0% 0% 0% 0% CAGR 0% 0% 0% 0% 0% 2017 2017 10% 5% 2018 2018 10% 5% 2019 2019 10% 5% 2020 2020 10% 5% CAGR 0% 0% 0% 0% 0% 0% CAGR 0% 0% 0% 0% 0% Use the model you have created to answer the following questions. What was the CAGR of the 'Estimated Total Market Size in Units'? What was the CAGR of the 'Direct Channel: Market Size' in Units? What was the CAGR of the competitor's 'Total Revenues'? What was the CAGR of the competitor's 'Direct Channel:Price'? What was the CAGR of the company's 'Total EBIT'? Did either company earn the majority of EBIT in Direct Channel? What was the impact of the competitors aggressive pricing strategy? Enter formulas in the yellow cells to create a model. Industry Unit Model Estimated Total Market Size in Units Growth Rate Estimated Percent Direct Channel Direct Channel: Market Size in Units Retail Channel: Market Size in Units Company Unit Models Direct Channel: Market Share Retail Channel: Market Share Direct Channel: Units Sold Retail Channel: Units Sold Total Units Sold Revenues Model Direct Channel: Price Retail Channel: Price Direct Channel: Revenues Retail Channel: Revenues Total Revenues 2017 630 33% 2017 50% 70% 2017 200 125 2018 15% 40% 2018 45% 75% 2018 200 125 2019 15% 48% Company 2019 40% 80% 2019 200 125 2020 15% 58% 2020 35% 85% 2020 200 125 CAGR 15% 20% 0% 0% CAGR -11% 7% 0% 0% 0% 0% CAGR 0% 0% 0% 0% 0% 2017 2017 190 125 Sole Competitor 2018 2019 2018 180 125 2019 170 125 2020 2020 160 125 CAGR 0% 0% 0% 0% 0% 0% CAGR -6% 0% 0% 0% 0% Gross Profit Model Unit Cost Direct Channel: Cost of Revenues Retail Channel: Cost of Revenues Direct Channel: Gross Profit Retail Channel: Gross Profit Total Gross Profit Total Gross Margin EBIT (Operating Profit) Model Direct Channel: SG&A Percent Retail Channel: SG&A Percent Direct Channel: SG&A Retail Channel: SG&A Direct Channel: EBIT Retail Channel: EBIT Total EBIT 2017 100 2017 10% 5% 2018 100 2018 10% 5% 2019 100 2019 10% 5% 2020 100 2020 10% 5% CAGR 0% 0% 0% 0% 0% 0% CAGR 0% 0% 0% 0% 0% 2017 2017 10% 5% 2018 2018 10% 5% 2019 2019 10% 5% 2020 2020 10% 5% CAGR 0% 0% 0% 0% 0% 0% CAGR 0% 0% 0% 0% 0% Use the model you have created to answer the following questions. What was the CAGR of the 'Estimated Total Market Size in Units'? What was the CAGR of the 'Direct Channel: Market Size' in Units? What was the CAGR of the competitor's 'Total Revenues'? What was the CAGR of the competitor's 'Direct Channel:Price'? What was the CAGR of the company's 'Total EBIT'? Did either company earn the majority of EBIT in Direct Channel? What was the impact of the competitors aggressive pricing strategy? Enter formulas in the yellow cells to create a model. Industry Unit Model Estimated Total Market Size in Units Growth Rate Estimated Percent Direct Channel Direct Channel: Market Size in Units Retail Channel: Market Size in Units Company Unit Models Direct Channel: Market Share Retail Channel: Market Share Direct Channel: Units Sold Retail Channel: Units Sold Total Units Sold Revenues Model Direct Channel: Price Retail Channel: Price Direct Channel: Revenues Retail Channel: Revenues Total Revenues 2017 630 33% 2017 50% 70% 2017 200 125 2018 15% 40% 2018 45% 75% 2018 200 125 2019 15% 48% Company 2019 40% 80% 2019 200 125 2020 15% 58% 2020 35% 85% 2020 200 125 CAGR 15% 20% 0% 0% CAGR -11% 7% 0% 0% 0% 0% CAGR 0% 0% 0% 0% 0% 2017 2017 190 125 Sole Competitor 2018 2019 2018 180 125 2019 170 125 2020 2020 160 125 CAGR 0% 0% 0% 0% 0% 0% CAGR -6% 0% 0% 0% 0% Gross Profit Model Unit Cost Direct Channel: Cost of Revenues Retail Channel: Cost of Revenues Direct Channel: Gross Profit Retail Channel: Gross Profit Total Gross Profit Total Gross Margin EBIT (Operating Profit) Model Direct Channel: SG&A Percent Retail Channel: SG&A Percent Direct Channel: SG&A Retail Channel: SG&A Direct Channel: EBIT Retail Channel: EBIT Total EBIT 2017 100 2017 10% 5% 2018 100 2018 10% 5% 2019 100 2019 10% 5% 2020 100 2020 10% 5% CAGR 0% 0% 0% 0% 0% 0% CAGR 0% 0% 0% 0% 0% 2017 2017 10% 5% 2018 2018 10% 5% 2019 2019 10% 5% 2020 2020 10% 5% CAGR 0% 0% 0% 0% 0% 0% CAGR 0% 0% 0% 0% 0% Use the model you have created to answer the following questions. What was the CAGR of the 'Estimated Total Market Size in Units'? What was the CAGR of the 'Direct Channel: Market Size' in Units? What was the CAGR of the competitor's 'Total Revenues'? What was the CAGR of the competitor's 'Direct Channel:Price'? What was the CAGR of the company's 'Total EBIT'? Did either company earn the majority of EBIT in Direct Channel? What was the impact of the competitors aggressive pricing strategy? Enter formulas in the yellow cells to create a model. Industry Unit Model Estimated Total Market Size in Units Growth Rate Estimated Percent Direct Channel Direct Channel: Market Size in Units Retail Channel: Market Size in Units Company Unit Models Direct Channel: Market Share Retail Channel: Market Share Direct Channel: Units Sold Retail Channel: Units Sold Total Units Sold Revenues Model Direct Channel: Price Retail Channel: Price Direct Channel: Revenues Retail Channel: Revenues Total Revenues 2017 630 33% 2017 50% 70% 2017 200 125 2018 15% 40% 2018 45% 75% 2018 200 125 2019 15% 48% Company 2019 40% 80% 2019 200 125 2020 15% 58% 2020 35% 85% 2020 200 125 CAGR 15% 20% 0% 0% CAGR -11% 7% 0% 0% 0% 0% CAGR 0% 0% 0% 0% 0% 2017 2017 190 125 Sole Competitor 2018 2019 2018 180 125 2019 170 125 2020 2020 160 125 CAGR 0% 0% 0% 0% 0% 0% CAGR -6% 0% 0% 0% 0% Gross Profit Model Unit Cost Direct Channel: Cost of Revenues Retail Channel: Cost of Revenues Direct Channel: Gross Profit Retail Channel: Gross Profit Total Gross Profit Total Gross Margin EBIT (Operating Profit) Model Direct Channel: SG&A Percent Retail Channel: SG&A Percent Direct Channel: SG&A Retail Channel: SG&A Direct Channel: EBIT Retail Channel: EBIT Total EBIT 2017 100 2017 10% 5% 2018 100 2018 10% 5% 2019 100 2019 10% 5% 2020 100 2020 10% 5% CAGR 0% 0% 0% 0% 0% 0% CAGR 0% 0% 0% 0% 0% 2017 2017 10% 5% 2018 2018 10% 5% 2019 2019 10% 5% 2020 2020 10% 5% CAGR 0% 0% 0% 0% 0% 0% CAGR 0% 0% 0% 0% 0% Use the model you have created to answer the following questions. What was the CAGR of the 'Estimated Total Market Size in Units'? What was the CAGR of the 'Direct Channel: Market Size' in Units? What was the CAGR of the competitor's 'Total Revenues'? What was the CAGR of the competitor's 'Direct Channel:Price'? What was the CAGR of the company's 'Total EBIT'? Did either company earn the majority of EBIT in Direct Channel? What was the impact of the competitors aggressive pricing strategy? Enter formulas in the yellow cells to create a model. Industry Unit Model Estimated Total Market Size in Units Growth Rate Estimated Percent Direct Channel Direct Channel: Market Size in Units Retail Channel: Market Size in Units Company Unit Models Direct Channel: Market Share Retail Channel: Market Share Direct Channel: Units Sold Retail Channel: Units Sold Total Units Sold Revenues Model Direct Channel: Price Retail Channel: Price Direct Channel: Revenues Retail Channel: Revenues Total Revenues 2017 630 33% 2017 50% 70% 2017 200 125 2018 15% 40% 2018 45% 75% 2018 200 125 2019 15% 48% Company 2019 40% 80% 2019 200 125 2020 15% 58% 2020 35% 85% 2020 200 125 CAGR 15% 20% 0% 0% CAGR -11% 7% 0% 0% 0% 0% CAGR 0% 0% 0% 0% 0% 2017 2017 190 125 Sole Competitor 2018 2019 2018 180 125 2019 170 125 2020 2020 160 125 CAGR 0% 0% 0% 0% 0% 0% CAGR -6% 0% 0% 0% 0% Gross Profit Model Unit Cost Direct Channel: Cost of Revenues Retail Channel: Cost of Revenues Direct Channel: Gross Profit Retail Channel: Gross Profit Total Gross Profit Total Gross Margin EBIT (Operating Profit) Model Direct Channel: SG&A Percent Retail Channel: SG&A Percent Direct Channel: SG&A Retail Channel: SG&A Direct Channel: EBIT Retail Channel: EBIT Total EBIT 2017 100 2017 10% 5% 2018 100 2018 10% 5% 2019 100 2019 10% 5% 2020 100 2020 10% 5% CAGR 0% 0% 0% 0% 0% 0% CAGR 0% 0% 0% 0% 0% 2017 2017 10% 5% 2018 2018 10% 5% 2019 2019 10% 5% 2020 2020 10% 5% CAGR 0% 0% 0% 0% 0% 0% CAGR 0% 0% 0% 0% 0% Use the model you have created to answer the following questions. What was the CAGR of the 'Estimated Total Market Size in Units'? What was the CAGR of the 'Direct Channel: Market Size' in Units? What was the CAGR of the competitor's 'Total Revenues'? What was the CAGR of the competitor's 'Direct Channel:Price'? What was the CAGR of the company's 'Total EBIT'? Did either company earn the majority of EBIT in Direct Channel? What was the impact of the competitors aggressive pricing strategy? Enter formulas in the yellow cells to create a model. Industry Unit Model Estimated Total Market Size in Units Growth Rate Estimated Percent Direct Channel Direct Channel: Market Size in Units Retail Channel: Market Size in Units Company Unit Models Direct Channel: Market Share Retail Channel: Market Share Direct Channel: Units Sold Retail Channel: Units Sold Total Units Sold Revenues Model Direct Channel: Price Retail Channel: Price Direct Channel: Revenues Retail Channel: Revenues Total Revenues 2017 630 33% 2017 50% 70% 2017 200 125 2018 15% 40% 2018 45% 75% 2018 200 125 2019 15% 48% Company 2019 40% 80% 2019 200 125 2020 15% 58% 2020 35% 85% 2020 200 125 CAGR 15% 20% 0% 0% CAGR -11% 7% 0% 0% 0% 0% CAGR 0% 0% 0% 0% 0% 2017 2017 190 125 Sole Competitor 2018 2019 2018 180 125 2019 170 125 2020 2020 160 125 CAGR 0% 0% 0% 0% 0% 0% CAGR -6% 0% 0% 0% 0% Gross Profit Model Unit Cost Direct Channel: Cost of Revenues Retail Channel: Cost of Revenues Direct Channel: Gross Profit Retail Channel: Gross Profit Total Gross Profit Total Gross Margin EBIT (Operating Profit) Model Direct Channel: SG&A Percent Retail Channel: SG&A Percent Direct Channel: SG&A Retail Channel: SG&A Direct Channel: EBIT Retail Channel: EBIT Total EBIT 2017 100 2017 10% 5% 2018 100 2018 10% 5% 2019 100 2019 10% 5% 2020 100 2020 10% 5% CAGR 0% 0% 0% 0% 0% 0% CAGR 0% 0% 0% 0% 0% 2017 2017 10% 5% 2018 2018 10% 5% 2019 2019 10% 5% 2020 2020 10% 5% CAGR 0% 0% 0% 0% 0% 0% CAGR 0% 0% 0% 0% 0% Use the model you have created to answer the following questions. What was the CAGR of the 'Estimated Total Market Size in Units'? What was the CAGR of the 'Direct Channel: Market Size' in Units? What was the CAGR of the competitor's 'Total Revenues'? What was the CAGR of the competitor's 'Direct Channel:Price'? What was the CAGR of the company's 'Total EBIT'? Did either company earn the majority of EBIT in Direct Channel? What was the impact of the competitors aggressive pricing strategy? Enter formulas in the yellow cells to create a model. Industry Unit Model Estimated Total Market Size in Units Growth Rate Estimated Percent Direct Channel Direct Channel: Market Size in Units Retail Channel: Market Size in Units Company Unit Models Direct Channel: Market Share Retail Channel: Market Share Direct Channel: Units Sold Retail Channel: Units Sold Total Units Sold Revenues Model Direct Channel: Price Retail Channel: Price Direct Channel: Revenues Retail Channel: Revenues Total Revenues 2017 630 33% 2017 50% 70% 2017 200 125 2018 15% 40% 2018 45% 75% 2018 200 125 2019 15% 48% Company 2019 40% 80% 2019 200 125 2020 15% 58% 2020 35% 85% 2020 200 125 CAGR 15% 20% 0% 0% CAGR -11% 7% 0% 0% 0% 0% CAGR 0% 0% 0% 0% 0% 2017 2017 190 125 Sole Competitor 2018 2019 2018 180 125 2019 170 125 2020 2020 160 125 CAGR 0% 0% 0% 0% 0% 0% CAGR -6% 0% 0% 0% 0% Gross Profit Model Unit Cost Direct Channel: Cost of Revenues Retail Channel: Cost of Revenues Direct Channel: Gross Profit Retail Channel: Gross Profit Total Gross Profit Total Gross Margin EBIT (Operating Profit) Model Direct Channel: SG&A Percent Retail Channel: SG&A Percent Direct Channel: SG&A Retail Channel: SG&A Direct Channel: EBIT Retail Channel: EBIT Total EBIT 2017 100 2017 10% 5% 2018 100 2018 10% 5% 2019 100 2019 10% 5% 2020 100 2020 10% 5% CAGR 0% 0% 0% 0% 0% 0% CAGR 0% 0% 0% 0% 0% 2017 2017 10% 5% 2018 2018 10% 5% 2019 2019 10% 5% 2020 2020 10% 5% CAGR 0% 0% 0% 0% 0% 0% CAGR 0% 0% 0% 0% 0% Use the model you have created to answer the following questions. What was the CAGR of the 'Estimated Total Market Size in Units'? What was the CAGR of the 'Direct Channel: Market Size' in Units? What was the CAGR of the competitor's 'Total Revenues'? What was the CAGR of the competitor's 'Direct Channel:Price'? What was the CAGR of the company's 'Total EBIT'? Did either company earn the majority of EBIT in Direct Channel? What was the impact of the competitors aggressive pricing strategy? Enter formulas in the yellow cells to create a model. Industry Unit Model Estimated Total Market Size in Units Growth Rate Estimated Percent Direct Channel Direct Channel: Market Size in Units Retail Channel: Market Size in Units Company Unit Models Direct Channel: Market Share Retail Channel: Market Share Direct Channel: Units Sold Retail Channel: Units Sold Total Units Sold Revenues Model Direct Channel: Price Retail Channel: Price Direct Channel: Revenues Retail Channel: Revenues Total Revenues 2017 630 33% 2017 50% 70% 2017 200 125 2018 15% 40% 2018 45% 75% 2018 200 125 2019 15% 48% Company 2019 40% 80% 2019 200 125 2020 15% 58% 2020 35% 85% 2020 200 125 CAGR 15% 20% 0% 0% CAGR -11% 7% 0% 0% 0% 0% CAGR 0% 0% 0% 0% 0% 2017 2017 190 125 Sole Competitor 2018 2019 2018 180 125 2019 170 125 2020 2020 160 125 CAGR 0% 0% 0% 0% 0% 0% CAGR -6% 0% 0% 0% 0% Gross Profit Model Unit Cost Direct Channel: Cost of Revenues Retail Channel: Cost of Revenues Direct Channel: Gross Profit Retail Channel: Gross Profit Total Gross Profit Total Gross Margin EBIT (Operating Profit) Model Direct Channel: SG&A Percent Retail Channel: SG&A Percent Direct Channel: SG&A Retail Channel: SG&A Direct Channel: EBIT Retail Channel: EBIT Total EBIT 2017 100 2017 10% 5% 2018 100 2018 10% 5% 2019 100 2019 10% 5% 2020 100 2020 10% 5% CAGR 0% 0% 0% 0% 0% 0% CAGR 0% 0% 0% 0% 0% 2017 2017 10% 5% 2018 2018 10% 5% 2019 2019 10% 5% 2020 2020 10% 5% CAGR 0% 0% 0% 0% 0% 0% CAGR 0% 0% 0% 0% 0% Use the model you have created to answer the following questions. What was the CAGR of the 'Estimated Total Market Size in Units'? What was the CAGR of the 'Direct Channel: Market Size' in Units? What was the CAGR of the competitor's 'Total Revenues'? What was the CAGR of the competitor's 'Direct Channel:Price'? What was the CAGR of the company's 'Total EBIT'? Did either company earn the majority of EBIT in Direct Channel? What was the impact of the competitors aggressive pricing strategy?
Expert Answer:

Related Book For 

Fundamentals of Financial Accounting
ISBN: 978-0078025914
5th edition
Authors: Fred Phillips, Robert Libby, Patricia Libby
Posted Date:
Students also viewed these accounting questions
-
Assume you are asked to create a model that predicts the number of new babies born per period according to the size of the stork population. In this case, the number of babies is Multiple Choice...
-
A hydrologist collected data to create a model to predict the volume flow for a stream at a bridge crossing using daily rainfall in inches. 0.15 0.30 0.33 0.45 0.75 0.25 0.52 0.70 25.04 11.92 14.25...
-
85 percent of Mexico's economic growth and 75 percent of its 100 million people are in the north, and the water is far to the south. . . . Politicians facing elections are reluctant to ask voters to...
-
A mortgage loan officer uses math on a continual basis during the mortgage lending process. When a prospective borrower applies for a loan, many calculations are made: debt-to-income- ratio,...
-
This exercise should be used with Exercise 1-21A. Refer to the data of Mary Burke Banking Company in Exercise 1-21A. Requirements 1. Prepare the income statement of Mary Burke Banking Company for the...
-
Solve each inequality algebraically. 3x - 5 X + 2 <2
-
Figure 27.40 shows a schematic of a device, called a mass spectrometer, for determining the mass of ions or other charged particles. The ions that enter the mass spectrometer are first accelerated by...
-
On July 11, 1984, Jose Padilla was working as a vacation-relief route salesperson for Frito-Lay. He testified that he made a route stop at Sals Beverage Shop, where he was told by Mrs. Ramos that she...
-
23. A convex mirror used for rear view on an automobile has a radius of curvature of 3m. If a bus is located at 5m from this mirror, find the position, nature and magnification of the image. 24. An...
-
Required: Nancy, who is 59 years old, is the beneficiary of a $220,000 life insurance policy. What amount of the insurance proceeds is taxable under each of the following scenarios? (Do not round any...
-
You run an A/B test on an email where 5682 users see version A and 5682 see version B. A version got a CTR of 1.2% and the B version got 3.2%. What is the 95% confidence interval for the difference...
-
Suppose that the opportunity-cost ratio for watches and cheese is 1C 1W in Switzerland but 1C 4W in Japan. At which of the following international exchange ratios (terms of trade) will Switzerland...
-
Recall the formula that states that $V = 1/P, where V is the value of the dollar and P is the price level. If the price level falls from 1 to 0.75, what will happen to the value of the dollar? a. It...
-
The current value of the Chemical Engineering Plant Cost Index (CEPCI) is 485. If at the same time next year the value has risen to 525 , what will be the average inflation rate for the year?
-
A friend of yours, Timorous ('Tim' for short) Ghostly, who has never taken an Accounting subject, has been assigned a short speech in his public speaking class. In this speech, Tim must describe the...
-
Suppose that the money supply is $1 trillion and money velocity is 4. Then the equation of exchange would predict nominal GDP to be: a. $1 trillion. b. $4 trillion. c. $5 trillion. d. $8 trillion.
-
Calculate the insurance premium values for Columns E and I. The formulas are based on a flat rate of $100 per policy, $35 added for each policy level, and 60% additional for each year under 100 in...
-
Marc Company assembles products from a group of interconnecting parts. The company produces some of the parts and buys some from outside vendors. The vendor for Part X has just increased its price by...
-
Courtney Company uses a periodic inventory system. The following data were available: beginning inventory, 1,000 units at $ 35; purchases, 4,000 units at $ 38; operating expenses (excluding income...
-
On January 1, Alan King decided to transfer an amount from his checking account into an investment account that later will provide $ 80,000 to send his son to college (four years from now). The...
-
Marshalls Corporation completed a $ 500,000, 7 percent bond issue on January 1, 2015. The bonds pay interest each December 31 and mature 10 years from January 1, 2015. Required: For each of the three...
-
Crane l uses 10 kJ of energy to lift a 50 kg box to the roof of a building. Crane 2 uses 20 kl to lift a 100 kg box the same distance. Which crane is more efficient? A. Crane 1 B. Crane 2 C. Both...
-
Christina throws a javelin into the air. As she propels it forward from rest, she does 270 J of work on it. At its highest point, its gravitational potential energy has increased by 70 J. What is the...
-
A runner is moving at a constant speed on level ground. Chemical energy in the runner's body is being transformed into other forms of energy. Most of the chemical energy is transformed into A....

Study smarter with the SolutionInn App