

Question: Enter formulas in the yellow cells to create a model. 2017 2018 2019 2016 650 CAGR 1596 1596 1596 Industry Unit Model Estimated Total Market
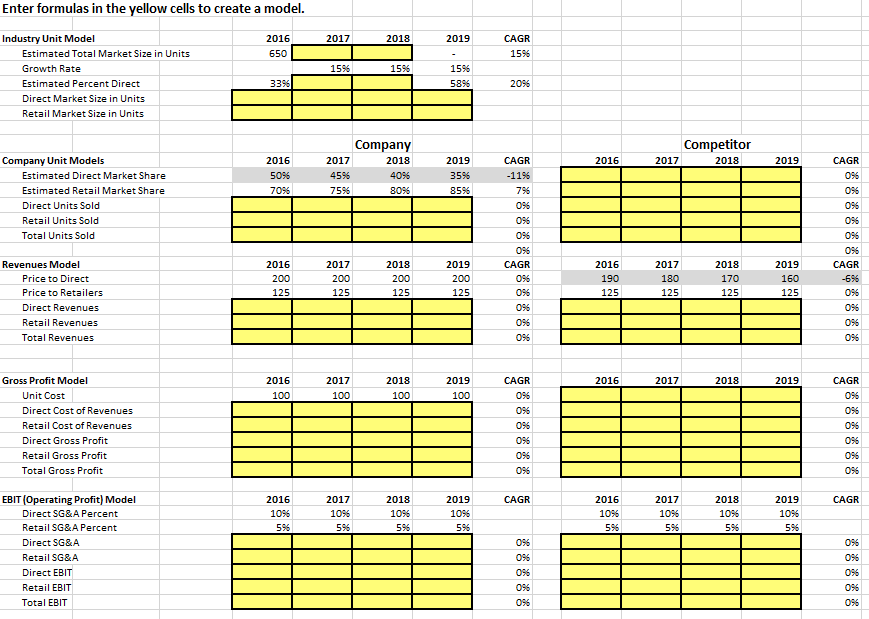
Enter formulas in the yellow cells to create a model. 2017 2018 2019 2016 650 CAGR 1596 1596 1596 Industry Unit Model Estimated Total Market Size in Units Growth Rate Estimated Percent Direct Direct Market Size in Units Retail Market Size in Units 1596 5896 3396 2096 Competitor 2016 2017 2018 2019 2016 5096 7096 Company 2017 2018 4596 4096 7596 8096 2019 3596 8596 Company Unit Models Estimated Direct Market Share Estimated Retail Market Share Direct Units Sold Retail Units Sold Total Units Sold CAGR -1196 796 096 096 096 096 CAGR 096 096 096 CAGR 096 096 096 096 096 096 CAGR -696 096 096 096 096 2016 200 125 2017 200 125 2018 200 125 2019 200 125 2016 190 125 2017 180 125 2018 170 125 2019 160 125 Revenues Model Price to Direct Price to Retailers Direct Revenues Retail Revenues Total Revenues 096 2016 2017 2018 2019 2016 100 2017 100 2018 100 2019 100 CAGR 096 096 Gross Profit Model Unit Cost Direct Cost of Revenues Retail Cost of Revenues Direct Gross Profit Retail Gross Profit Total Gross Profit CAGR 096 096 096 096 096 0% 096 096 096 096 CAGR CAGR 2016 1096 596 2017 1096 596 2018 1096 596 2019 1096 596 2016 1096 596 2017 1096 596 2018 1096 596 2019 1096 596 096 EBIT (Operating Profit) Model Direct SG&A Percent Retail SG&A Percent Direct SG&A Retail SG&A Direct EBIT Retail EBIT Total EBIT 096 096 096 096 096 096 096 096 096 Enter formulas in the yellow cells to create a model. 2017 2018 2019 2016 650 CAGR 1596 1596 1596 Industry Unit Model Estimated Total Market Size in Units Growth Rate Estimated Percent Direct Direct Market Size in Units Retail Market Size in Units 1596 5896 3396 2096 Competitor 2016 2017 2018 2019 2016 5096 7096 Company 2017 2018 4596 4096 7596 8096 2019 3596 8596 Company Unit Models Estimated Direct Market Share Estimated Retail Market Share Direct Units Sold Retail Units Sold Total Units Sold CAGR -1196 796 096 096 096 096 CAGR 096 096 096 CAGR 096 096 096 096 096 096 CAGR -696 096 096 096 096 2016 200 125 2017 200 125 2018 200 125 2019 200 125 2016 190 125 2017 180 125 2018 170 125 2019 160 125 Revenues Model Price to Direct Price to Retailers Direct Revenues Retail Revenues Total Revenues 096 2016 2017 2018 2019 2016 100 2017 100 2018 100 2019 100 CAGR 096 096 Gross Profit Model Unit Cost Direct Cost of Revenues Retail Cost of Revenues Direct Gross Profit Retail Gross Profit Total Gross Profit CAGR 096 096 096 096 096 0% 096 096 096 096 CAGR CAGR 2016 1096 596 2017 1096 596 2018 1096 596 2019 1096 596 2016 1096 596 2017 1096 596 2018 1096 596 2019 1096 596 096 EBIT (Operating Profit) Model Direct SG&A Percent Retail SG&A Percent Direct SG&A Retail SG&A Direct EBIT Retail EBIT Total EBIT 096 096 096 096 096 096 096 096 096
Step by Step Solution
There are 3 Steps involved in it

Get step-by-step solutions from verified subject matter experts