

Question: Enter the data from the table below into Minitab. Perform the one-sample t-test on appropriate hypotheses using the p-value approach at significance level .05.
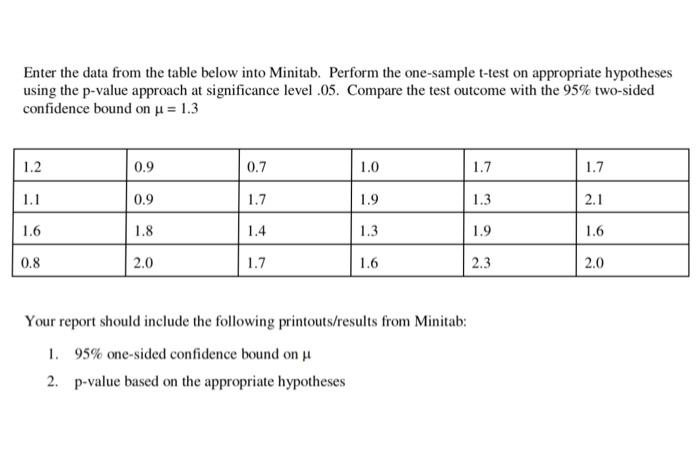
Enter the data from the table below into Minitab. Perform the one-sample t-test on appropriate hypotheses using the p-value approach at significance level .05. Compare the test outcome with the 95% two-sided confidence bound on = 1.3 1.1 216 1.2 0.9 0.7 1.0 1.7 1.7 0.9 1.7 1.9 1.3 2.1 1.6 1.8 1.4 1.3 1.9 1.6 0.8 2.0 1.7 1.6 2.3 2.0 Your report should include the following printouts/results from Minitab: 1. 95% one-sided confidence bound on 2. p-value based on the appropriate hypotheses
Step by Step Solution
There are 3 Steps involved in it
1 Expert Approved Answer
Step: 1 Unlock

Question Has Been Solved by an Expert!
Get step-by-step solutions from verified subject matter experts
Step: 2 Unlock
Step: 3 Unlock