

Enterprise Industries produces Fresh, a brand of liquid detergent. In order to more effectively manage its...
Fantastic news! We've Found the answer you've been seeking!
Question:

Transcribed Image Text:
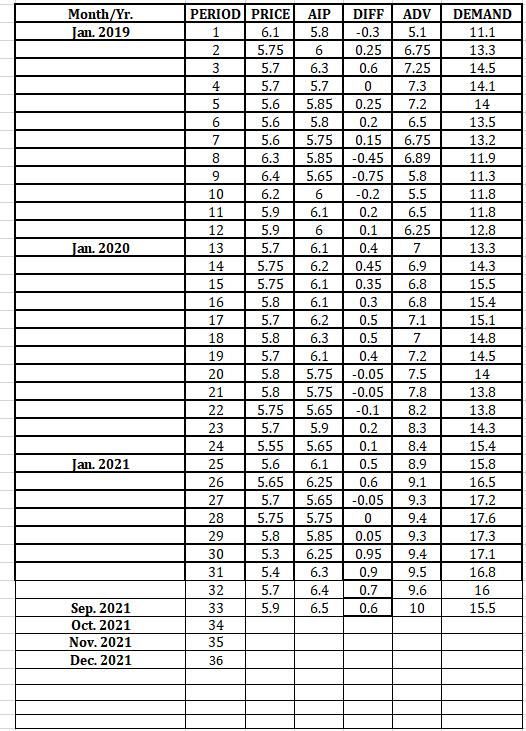
Enterprise Industries produces Fresh, a brand of liquid detergent. In order to more effectively manage its inventory, the company would like to better predict demand for Fresh. To develop a prediction model, the company has gathered data concerning demand for Fresh over the last 33 sales periods. Each sales period is defined as one month. The variables are as follows: Period = Time period in month Demand = Y = demand for a large size bottle of Fresh (in 100,000) Price = the price of Fresh as offered by Ent. Industries AIP = the average industry price ADV = Ent. Industries Advertising Expenditure (in $100,000) to Promote Fresh in the sales period. DIFF = AIP - Price = the "price difference" in the sales period 1- Download the data from Course Blackboard site into Excel spreadsheet. 2- Make time series scatter plots of all five variables (five graphs). Insert trend line, equation, and R-squared. Observe graphs and provide interpretation. 3- Construct scatter plots of Demand vs. DIFF and Demand vs. ADV, Demand vs. AIP, and Demand vs. Price. Insert fitted line, equation, and R-squared. Observe graphs and provide interpretation. Note that Demand is always on the Y axis. 4- Obtain the correlation matrix for all six variables and rank the variables that have strong correlation with Demand (must use absolute value.) Explain your findings in plain language. 5- Use 3-month and 6-month moving averages to predict the demand for October 2021. Find MAD for both forecasts and identify the preferred one based on each calculation. Is the moving average suitable method for forecasting for this data set? Explain your reasoning. 6- Use Exponential smoothing forecasts with alpha of 0.1, 0.2, ., 0.9 to predict October 2021 demand. Identify the value of alpha that results in the lowest MAD. .... PERIOD PRICE Month/Yr. Jan. 2019 AIP DIFF ADV DEMAND 6.1 5.8 -0.3 5.1 11.1 5.75 5.7 5.7 5.6 2 6 0.25 6.75 13.3 6.3 0.6 7.25 14.5 4 5.7 7.3 14.1 5.85 0.25 7.2 14 5.6 5.8 6.5 13.5 6. 7. 0.2 5.6 5.75 0.15 6.75 13.2 6.3 5.85 -0.45 11.9 6.89 5.8 6.4 5.65 -0.75 11.3 10 6.2 -0.2 5.5 11.8 11 5.9 6.1 0.2 6.5 11.8 12 5.9 0.1 6.25 12.8 Jan. 2020 13 5.7 6.1 0.4 7 13.3 5.75 5.75 14 6.2 0.45 6.9 14.3 15 6.1 0.35 6.8 15.5 16 5.8 6.1 0.3 6.8 15.4 17 5.7 6.2 0.5 7.1 15.1 18 5.8 6.3 0.5 14.8 5.7 5.8 19 6.1 0.4 7.2 14.5 7.5 5.75 5.75 20 -0.05 14 21 5.8 -0.05 7.8 13.8 5.75 5.65 5.9 22 -0.1 8.2 13.8 5.7 5.55 5.6 5.65 23 0.2 8.3 14.3 24 5.65 0.1 8.4 15.4 Jan. 2021 25 6.1 0.5 8.9 15.8 26 6.25 0.6 9.1 16.5 9.3 5.7 5.75 5.8 5.3 5.65 5.75 27 -0.05 17.2 28 9.4 17.6 29 5.85 0.05 9.3 17.3 6.25 6.3 30 0.95 9.4 17.1 31 5.4 0.9 9.5 16.8 32 5.7 6.4 0.7 9.6 16 Sep. 2021 Oct. 2021 33 5.9 6.5 0.6 10 15.5 34 Nov. 2021 35 Dec. 2021 36 Enterprise Industries produces Fresh, a brand of liquid detergent. In order to more effectively manage its inventory, the company would like to better predict demand for Fresh. To develop a prediction model, the company has gathered data concerning demand for Fresh over the last 33 sales periods. Each sales period is defined as one month. The variables are as follows: Period = Time period in month Demand = Y = demand for a large size bottle of Fresh (in 100,000) Price = the price of Fresh as offered by Ent. Industries AIP = the average industry price ADV = Ent. Industries Advertising Expenditure (in $100,000) to Promote Fresh in the sales period. DIFF = AIP - Price = the "price difference" in the sales period 1- Download the data from Course Blackboard site into Excel spreadsheet. 2- Make time series scatter plots of all five variables (five graphs). Insert trend line, equation, and R-squared. Observe graphs and provide interpretation. 3- Construct scatter plots of Demand vs. DIFF and Demand vs. ADV, Demand vs. AIP, and Demand vs. Price. Insert fitted line, equation, and R-squared. Observe graphs and provide interpretation. Note that Demand is always on the Y axis. 4- Obtain the correlation matrix for all six variables and rank the variables that have strong correlation with Demand (must use absolute value.) Explain your findings in plain language. 5- Use 3-month and 6-month moving averages to predict the demand for October 2021. Find MAD for both forecasts and identify the preferred one based on each calculation. Is the moving average suitable method for forecasting for this data set? Explain your reasoning. 6- Use Exponential smoothing forecasts with alpha of 0.1, 0.2, ., 0.9 to predict October 2021 demand. Identify the value of alpha that results in the lowest MAD. .... PERIOD PRICE Month/Yr. Jan. 2019 AIP DIFF ADV DEMAND 6.1 5.8 -0.3 5.1 11.1 5.75 5.7 5.7 5.6 2 6 0.25 6.75 13.3 6.3 0.6 7.25 14.5 4 5.7 7.3 14.1 5.85 0.25 7.2 14 5.6 5.8 6.5 13.5 6. 7. 0.2 5.6 5.75 0.15 6.75 13.2 6.3 5.85 -0.45 11.9 6.89 5.8 6.4 5.65 -0.75 11.3 10 6.2 -0.2 5.5 11.8 11 5.9 6.1 0.2 6.5 11.8 12 5.9 0.1 6.25 12.8 Jan. 2020 13 5.7 6.1 0.4 7 13.3 5.75 5.75 14 6.2 0.45 6.9 14.3 15 6.1 0.35 6.8 15.5 16 5.8 6.1 0.3 6.8 15.4 17 5.7 6.2 0.5 7.1 15.1 18 5.8 6.3 0.5 14.8 5.7 5.8 19 6.1 0.4 7.2 14.5 7.5 5.75 5.75 20 -0.05 14 21 5.8 -0.05 7.8 13.8 5.75 5.65 5.9 22 -0.1 8.2 13.8 5.7 5.55 5.6 5.65 23 0.2 8.3 14.3 24 5.65 0.1 8.4 15.4 Jan. 2021 25 6.1 0.5 8.9 15.8 26 6.25 0.6 9.1 16.5 9.3 5.7 5.75 5.8 5.3 5.65 5.75 27 -0.05 17.2 28 9.4 17.6 29 5.85 0.05 9.3 17.3 6.25 6.3 30 0.95 9.4 17.1 31 5.4 0.9 9.5 16.8 32 5.7 6.4 0.7 9.6 16 Sep. 2021 Oct. 2021 33 5.9 6.5 0.6 10 15.5 34 Nov. 2021 35 Dec. 2021 36
Expert Answer:
Answer rating: 100% (QA)
PRICE AIP 65 66 y00074 SB641 64 64 0 OB43 62 62 y000 5919... View the full answer

Posted Date:
Students also viewed these accounting questions
-
Enterprise Industries produces Fresh, a brand of liquid laundry detergent. In order to study the relationship between price and demand for the large bottle of Fresh, the company has gathered data...
-
Enterprise Industries produces Fresh, a brand of liquid laundry detergent. In order to manage its inventory more effectively and make revenue projections, the company would like to better predict...
-
Enterprise Industries produces Fresh, a brand of liquid laundry detergent. In order to study the relationship between price and demand for the large bottle of Fresh, the company has gathered data...
-
United Research Associates (URA) had received a contract to produce two units of a new cruise missile guidance control. The first unit took 4,000 hours to complete and cost $ 30,000 in materials and...
-
What are the rights and obligations of employers? What are the rights and obligations of employees?
-
How do we finance our business? Financial decisions are critical for a company. It is important for a company to create value for its owners by earning a high return and by controlling its risk....
-
Each of the wires 1 to 3 in Figure P28.39 carries a current perpendicular to the page. The line integrals of the magnetic field around the three Amprian paths shown all have the same positive value....
-
List the master files that would be necessary to implement the CRUISE AVAILABILITY INQUIRY.
-
6. An igloo, a hemispherical enclosure built of ice (1.67 J/m-sC), has as inner radius of 2.50m. The thickness of the ice is 0.5m. At what rate must thermal energy be generated to maintain the air...
-
Dwight Donovan, the president of Donovan Enterprises, is considering two investment opportunities. Because of limited resources, he will be able to invest in only one of them. Project A is to...
-
Shadee Corporation expects to sell 520 sun shades in May and 320 in June. Each shade sells for $148. Shadee's beginning and ending finished goods inventories for May are 70 and 50 shades,...
-
People immersed in strong unchanging magnetic fields occasionally report sensing a metallic taste. Some investigators suspect that motion in the constant field could produce a changing flux and a...
-
All ferromagnetic materials have a Curie temperature, a temperature above which they will cease to be magnetic. Explain in some detail why you might expect this to be so.
-
At what point in the process of muscle contraction is ATP required?
-
What are the functions of bone marrow?
-
A particular species of copepod, a small marine crustacean, emits a flash of light consisting of \(1.4 \times 10^{10}\) photons at a wavelength of \(490 \mathrm{~nm}\). The flash lasts for \(2.4...
-
Who are the main competitors of Adidas? Where are the competitor's retailers located? How close to each other are the other branches of Adidas and Nike retailer? Is Adidas and Nike retailer in a...
-
Assume a simple Keynesian depression economy with a multiplier of 4 and an initial equilibrium income of $3,000. Saving and investment equal $400, and assume full employment income is $4,000. a. What...
-
If a company has a net profit margin of 12% and a tax rate of 40%, the before-tax profit margin is closest to: A. 7.2%. B. 12.4%. C. 20.0%.
-
If a companys operating profit margin is 4% and its total asset turnover is 1.5 times, its operating return on assets is: A. 2.7%. B. 6.0%. C. 7.3%.
-
The DuPont system allows us to break down the return on equity into: A. return on assets and the financial leverage ratio. B. profit margin, the tax retention ratio, and inventory turnover. C. gross...

Study smarter with the SolutionInn App