

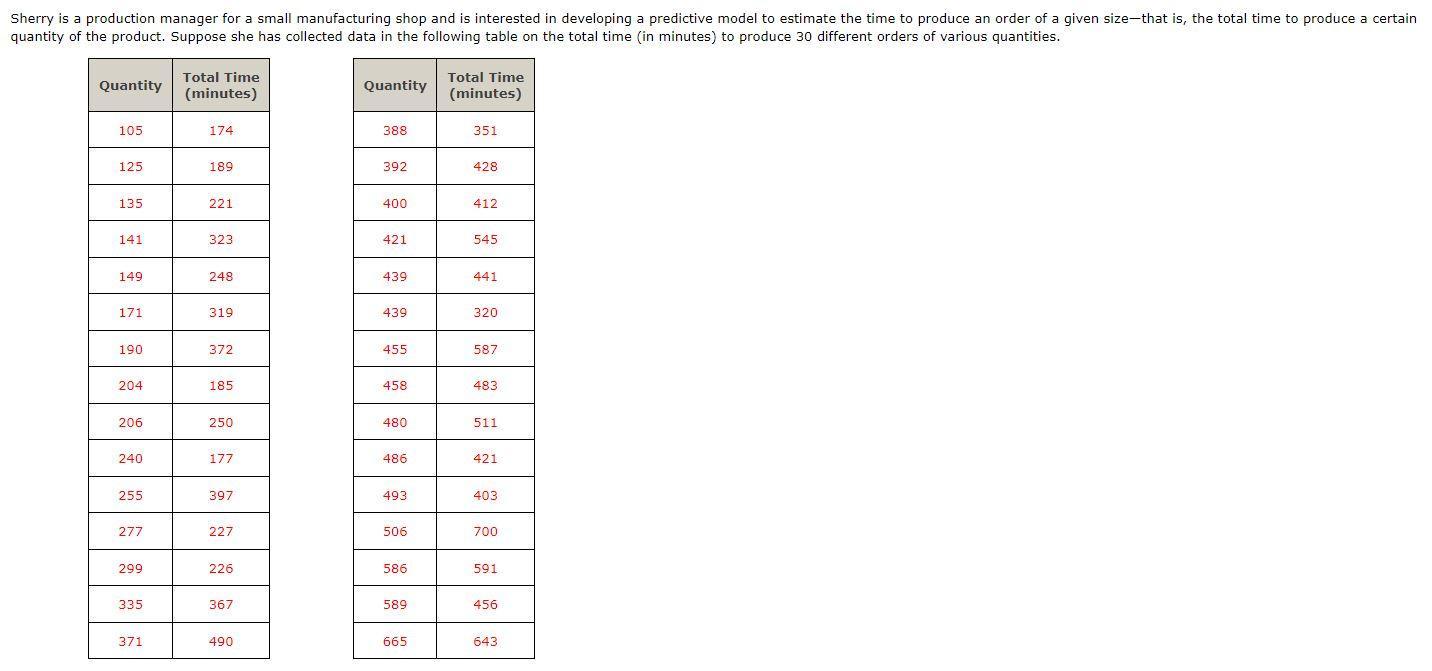
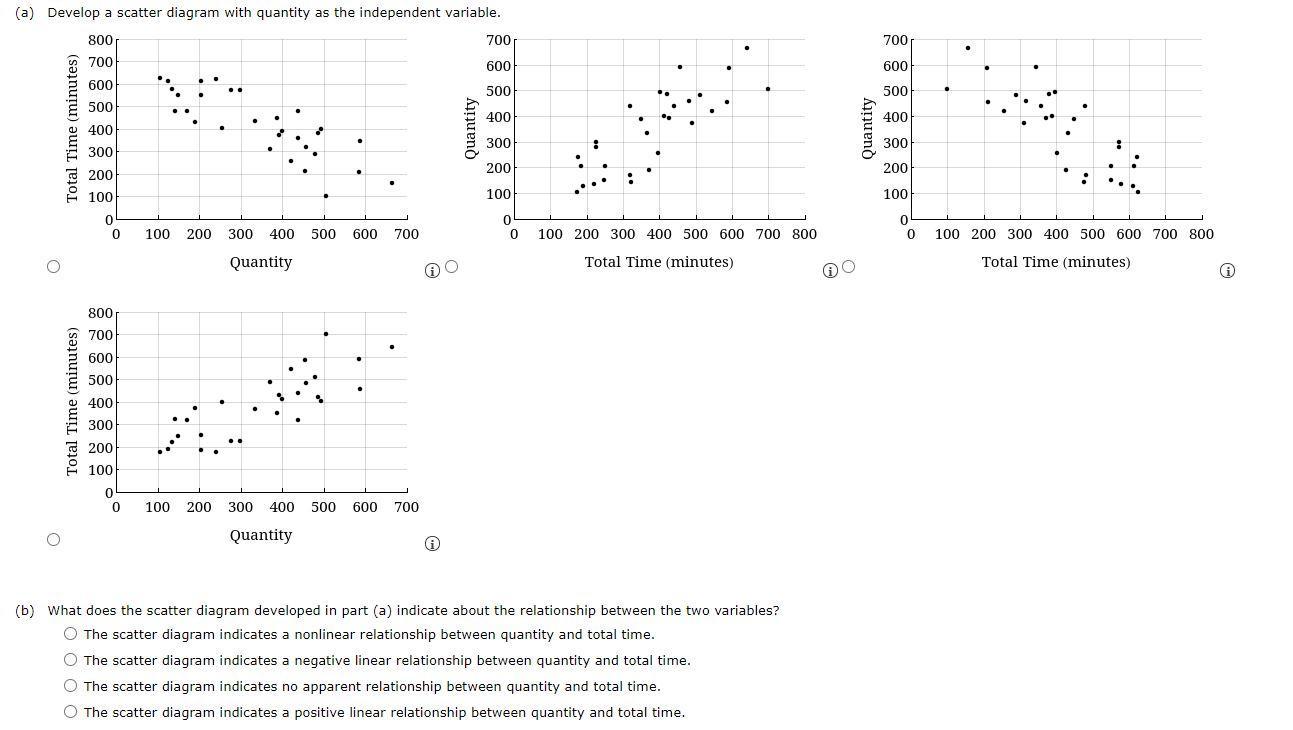
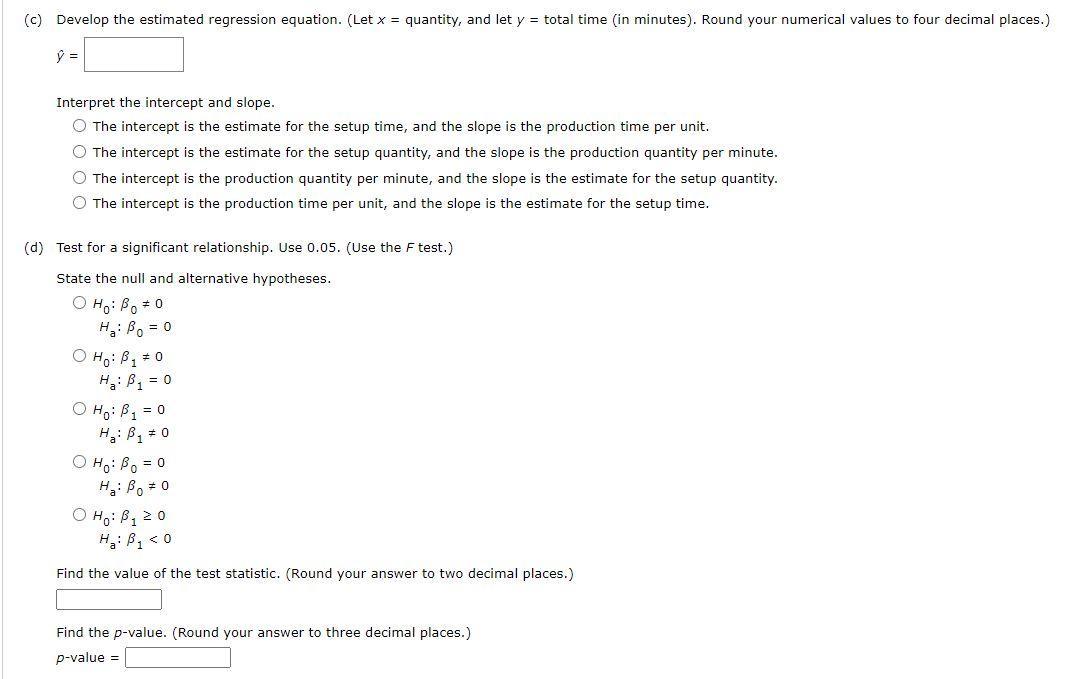
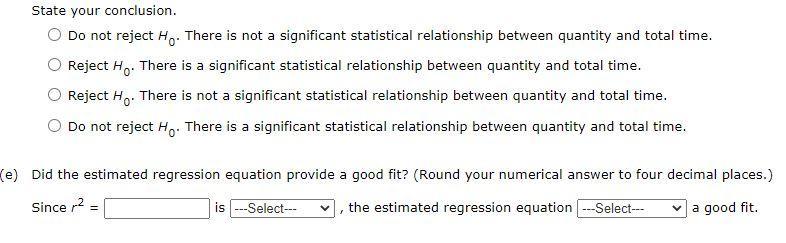
Sherry is a production manager for a small manufacturing shop and is interested in developing a...
Fantastic news! We've Found the answer you've been seeking!
Question:
Transcribed Image Text:
Sherry is a production manager for a small manufacturing shop and is interested in developing a predictive model to estimate the time to produce an order of a given size-that is, the total time to produce a certain quantity of the product. Suppose she has collected data in the following table on the total time (in minutes) to produce 30 different orders of various quantities. Total Time Total Time Quantity Quantity (minutes) (minutes) 105 174 388 351 125 189 392 428 135 221 400 412 141 323 421 545 149 248 439 441 171 319 439 320 190 372 455 587 204 185 458 483 206 250 480 511 240 177 486 421 255 397 493 403 277 227 506 700 299 226 586 591 335 367 589 456 371 490 665 643 (a) Develop a scatter diagram with quantity as the independent variable. 800 700 700 700 600 600 600 500 500 500 400 400 400 300 300 300 200 200 200 100 100 100 100 200 300 400 500 600 700 100 200 300 400 500 600 700 800 100 200 300 400 500 600 700 800 Quantity Total Time (minutes) Total Time (minutes) 800 700 600 500 400 300 200 100 0. 100 200 300 400 500 600 700 Quantity (b) What does the scatter diagram developed in part (a) indicate about the relationship between the two variables? O The scatter diagram indicates a nonlinear relationship between quantity and total time. O The scatter diagram indicates a negative linear relationship between quantity and total time. O The scatter diagram indicates no apparent relationship between quantity and total time. O The scatter diagram indicates a positive linear relationship between quantity and total time. Total Time (minutes) Quantity (c) Develop the estimated regression equation. (Let x = quantity, and let y = total time (in minutes). Round your numerical values to four decimal places.) Interpret the intercept and slope. O The intercept is the estimate for the setup time, and the slope is the production time per unit. O The intercept is the estimate for the setup quantity, and the slope is the production quantity per minute. O The intercept is the production quantity per minute, and the slope is the estimate for the setup quantity. O The intercept is the production time per unit, and the slope is the estimate for the setup time. (d) Test for a significant relationship. Use 0.05. (Use the F test.) State the null and alternative hypotheses. O Ho: Bo + 0 H: Bo = 0 O Ho: B1 0 Ha: B = 0 O Ho: B1 = 0 H: B1 # 0 0 = °g :°H O H: Bo # 0 O Ho: B120 H: B1 < 0 Find the value of the test statistic. (Round your answer to two decimal places.) Find the p-value. (Round your answer to three decimal places.) p-value = State your conclusion. Do not reject Ho: There is not a significant statistical relationship between quantity and total time. Reject H,. There is a significant statistical relationship between quantity and total time. Reject H,. There is not a significant statistical relationship between quantity and total time. O Do not reject Ho. There is a significant statistical relationship between quantity and total time. (e) Did the estimated regression equation provide a good fit? (Round your numerical answer to four decimal places.) Since r2: the estimated regression equation --Select-- v a good fit. is --Select--- Sherry is a production manager for a small manufacturing shop and is interested in developing a predictive model to estimate the time to produce an order of a given size-that is, the total time to produce a certain quantity of the product. Suppose she has collected data in the following table on the total time (in minutes) to produce 30 different orders of various quantities. Total Time Total Time Quantity Quantity (minutes) (minutes) 105 174 388 351 125 189 392 428 135 221 400 412 141 323 421 545 149 248 439 441 171 319 439 320 190 372 455 587 204 185 458 483 206 250 480 511 240 177 486 421 255 397 493 403 277 227 506 700 299 226 586 591 335 367 589 456 371 490 665 643 (a) Develop a scatter diagram with quantity as the independent variable. 800 700 700 700 600 600 600 500 500 500 400 400 400 300 300 300 200 200 200 100 100 100 100 200 300 400 500 600 700 100 200 300 400 500 600 700 800 100 200 300 400 500 600 700 800 Quantity Total Time (minutes) Total Time (minutes) 800 700 600 500 400 300 200 100 0. 100 200 300 400 500 600 700 Quantity (b) What does the scatter diagram developed in part (a) indicate about the relationship between the two variables? O The scatter diagram indicates a nonlinear relationship between quantity and total time. O The scatter diagram indicates a negative linear relationship between quantity and total time. O The scatter diagram indicates no apparent relationship between quantity and total time. O The scatter diagram indicates a positive linear relationship between quantity and total time. Total Time (minutes) Quantity (c) Develop the estimated regression equation. (Let x = quantity, and let y = total time (in minutes). Round your numerical values to four decimal places.) Interpret the intercept and slope. O The intercept is the estimate for the setup time, and the slope is the production time per unit. O The intercept is the estimate for the setup quantity, and the slope is the production quantity per minute. O The intercept is the production quantity per minute, and the slope is the estimate for the setup quantity. O The intercept is the production time per unit, and the slope is the estimate for the setup time. (d) Test for a significant relationship. Use 0.05. (Use the F test.) State the null and alternative hypotheses. O Ho: Bo + 0 H: Bo = 0 O Ho: B1 0 Ha: B = 0 O Ho: B1 = 0 H: B1 # 0 0 = °g :°H O H: Bo # 0 O Ho: B120 H: B1 < 0 Find the value of the test statistic. (Round your answer to two decimal places.) Find the p-value. (Round your answer to three decimal places.) p-value = State your conclusion. Do not reject Ho: There is not a significant statistical relationship between quantity and total time. Reject H,. There is a significant statistical relationship between quantity and total time. Reject H,. There is not a significant statistical relationship between quantity and total time. O Do not reject Ho. There is a significant statistical relationship between quantity and total time. (e) Did the estimated regression equation provide a good fit? (Round your numerical answer to four decimal places.) Since r2: the estimated regression equation --Select-- v a good fit. is --Select---
Expert Answer:
Answer rating: 100% (QA)
Solution Given data shewing predictive model to estimate the time to uoduce an oider of a given size ... View the full answer

Posted Date:
Students also viewed these accounting questions
-
Sherry is a production manager for a small manufacturing shop and is interested in developing a predictive model to estimate the time to produce an order of a given sizethat is, the total time to...
-
a. Develop a scatter diagram with price as the independent variable. b. An exercise equipment store that sells primarily higher priced equipment has a sign over the display area that says "Quality:...
-
Akawasi Sudawa is a production manager for HAL, a firm that specializes in manufacturing high-precision aircraft components. For a new product, Akawasi is trying to decide whether his company should...
-
The MRP gross requirements for Item A are shown here for the next 10 weeks. Lead time for A is three weeks and setup cost is $ 10. There is a carrying cost of $ 0.01 per unit per week. Beginning...
-
Kendall Yacht Corporation was running into financial problems. Its owners, Lawrence and Linda Kendall, obtained permission from its bank, United California, with which it had corporate accounts, to...
-
Evaluate the following statement: Companies that issue a lot of new debt and equity to create cash are usually in a bad financial condition.
-
The line integral of the magnetic field around a certain closed path is initially \(L\). The current that penetrates this path is then doubled. What can you say about the current through the path if...
-
Edwards Manufacturing Company (EMC) is considering replacing one machine with another. The old machine was purchased 3 years ago for an installed cost of $10,000. The firm is depreciating the machine...
-
6. The number of (staircase) paths in the xy-plane from (0, 0) to (7, 5) where each such path is made up of individual steps going one unit upward (U) or one unit to the right (R). (a) 12C5 (b) 12!...
-
Shauna Coleman is single. She is employed as an architectural designer for Streamline Design (SD). Shauna wanted to determine her taxable income for this year. She correctly calculated her AGI....
-
Research a product or service sold under a competitive model (perfect, monopoly, monopolistic, or oligopoly competition). Discuss the contributing factors that result in its classification under the...
-
What is the problem with achieving rapidly traveling action potentials through large numbers of giant axons?
-
On a brilliant, sunny day, you take a long hike through open country. You sweat a lot, losing a lot of water. What hormone does your body release? Why?
-
In reading the instruction manual that came with your garagedoor opener, you see that the transmitter unit in your car produces a \(250 \mathrm{~mW}\) signal and that the receiver unit is supposed to...
-
What are endorphins, and what causes cells in the brain to release them?
-
John is changing a lightbulb in a lamp. It's a warm summer B10 evening, and the resistance of his damp skin is only \(4000 \Omega\). While one hand is holding the grounded metal frame of the lamp,...
-
The following information came from the books and records of Davao Corporation and its branch. The balances are as of December 31, 20x8, the fourth year of the corporation's existence. Sales...
-
The following information is for Montreal Gloves Inc. for the year 2020: Manufacturing costs Number of gloves manufactured Beginning inventory $ 3,016,700 311,000 pairs 0 pairs Sales in 2020 were...
-
Suppose that LaPearlas revenues are expected to grow at a rate of 10% and all elements of the income statement and balance sheet are sales-driven except for the tax burden, which remains at 30%....
-
If LaPearlas long-term debt and paid-in capital accounts remain at their 2005 levels, the tax rate remains at the 2005 rate, and all other income statement and balance sheet accounts are sales-driven...
-
If Sky Systems were to be acquired by Modern Auto under the terms of the original offer, the post-merger EPS of the new company would be closest to: A. \($2.00\). B. \($2.32\). C. \($2.63\). Modern...

Study smarter with the SolutionInn App