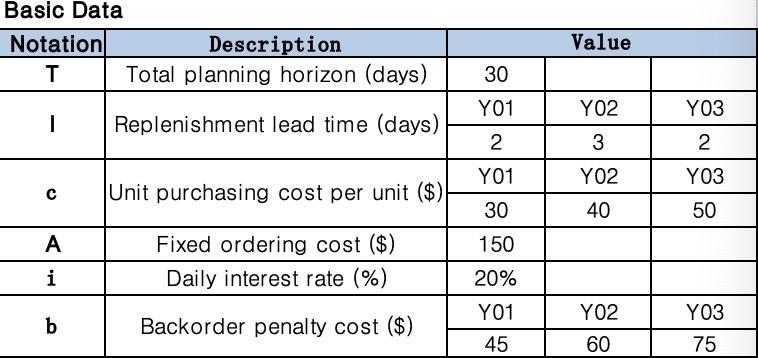
Question: EOQ model Basic Data Notation Description T Total planning horizon (days) Value 30 Y01 YO2 YO3 1 Replenishment lead time (days) 2 3 2 Y01

EOQ model

EOQ model Basic Data Notation Description T TotalEOQ model Basic Data Notation Description T TotalEOQ model Basic Data Notation Description T Total

Basic Data Notation Description T Total planning horizon (days) Value 30 Y01 YO2 YO3 1 Replenishment lead time (days) 2 3 2 Y01 YO2 Unit purchasing cost per unit ($) YO3 50 30 40 A 150 Fixed ordering cost ($) Daily interest rate (%) Po i 20% b Backorder penalty cost ($) Y01 45 YO2 60 YO3 75 4 4 LO 6 8 14 YO1 Day 1 Demand 11 Day 16 Demand 13 7 11 9 12 10 13 11 12 12 13 13 12 15 11 14 14 12 11 12 2 12 17 11 3 12 18 13 19 20 21 22 23 24 25 26 27 28 29 30 12 13 12 12 10 10 12 12 12 13 12 11 LO YO2 Day 1 Demand 10 Day 16 Demand 13 2 13 17 13 3 8 18 13 4 9 19 10 11 20 10 6 8 21 10 7 13 22 8 8 12 23 10 9 11 24 13 10 13 25 10 11 9 26 9 12 10 27 9 13 13 28 12 14 8 29 11 15 12 30 9 2. YO3 Day 1 Demand 15 Day 16 Demand 16 14 17 18 3 14 18 17 4 16 19 17 5 15 20 15 6 13 21 16 7 17 22 14 8 16 23 13 9 15 24 18 10 15 25 16 11 16 26 14 12 | 13 14 17 13 18 27 28 29 14 16 18 15 17 30 17 Q. T. Day Order quantity Cost Replenishm net amount Inventory Backorder 30 0 1 2 3 4 5 6 7 8 9 10 11 12 13 14 15 16 17 18 19 20 21 22 23 24 25 26 27 28 29 30 Demand 0 11 12 12 14 14 12 11 11 12 13 12 13 12 12 11 13 11 13 12 13 12 12 10 10 12 12 12 13 12 11 Result Total order quantity Total order frequency Total Inventory Total backorder Cost Total purchase cost Total ordering cost Total Inventory cost Total backorder cost Total cost Basic Data Notation Description T Total planning horizon (days) Value 30 Y01 YO2 YO3 1 Replenishment lead time (days) 2 3 2 Y01 YO2 Unit purchasing cost per unit ($) YO3 50 30 40 A 150 Fixed ordering cost ($) Daily interest rate (%) Po i 20% b Backorder penalty cost ($) Y01 45 YO2 60 YO3 75 4 4 LO 6 8 14 YO1 Day 1 Demand 11 Day 16 Demand 13 7 11 9 12 10 13 11 12 12 13 13 12 15 11 14 14 12 11 12 2 12 17 11 3 12 18 13 19 20 21 22 23 24 25 26 27 28 29 30 12 13 12 12 10 10 12 12 12 13 12 11 LO YO2 Day 1 Demand 10 Day 16 Demand 13 2 13 17 13 3 8 18 13 4 9 19 10 11 20 10 6 8 21 10 7 13 22 8 8 12 23 10 9 11 24 13 10 13 25 10 11 9 26 9 12 10 27 9 13 13 28 12 14 8 29 11 15 12 30 9 2. YO3 Day 1 Demand 15 Day 16 Demand 16 14 17 18 3 14 18 17 4 16 19 17 5 15 20 15 6 13 21 16 7 17 22 14 8 16 23 13 9 15 24 18 10 15 25 16 11 16 26 14 12 | 13 14 17 13 18 27 28 29 14 16 18 15 17 30 17 Q. T. Day Order quantity Cost Replenishm net amount Inventory Backorder 30 0 1 2 3 4 5 6 7 8 9 10 11 12 13 14 15 16 17 18 19 20 21 22 23 24 25 26 27 28 29 30 Demand 0 11 12 12 14 14 12 11 11 12 13 12 13 12 12 11 13 11 13 12 13 12 12 10 10 12 12 12 13 12 11 Result Total order quantity Total order frequency Total Inventory Total backorder Cost Total purchase cost Total ordering cost Total Inventory cost Total backorder cost Total cost

Step by Step Solution

There are 3 Steps involved in it

1 Expert Approved Answer
Step: 1 Unlock blur-text-image
Question Has Been Solved by an Expert!

Get step-by-step solutions from verified subject matter experts

Step: 2 Unlock
Step: 3 Unlock

Students Have Also Explored These Related General Management Questions!